IDE Integration
🧑💻 IDE Integration
Developers move fastest without leaving their IDE. Dynatrace supports VS Code and JetBrains with the Observability for Developers extension, so you can set Live Debugging breakpoints and read snapshots right where you write code. Read more about the IDE extensions.
Everything you did in the Live Debugger app you can also do from your own IDE. This section shows the VS Code flow; JetBrains is equivalent.
Install the Dynatrace extension#
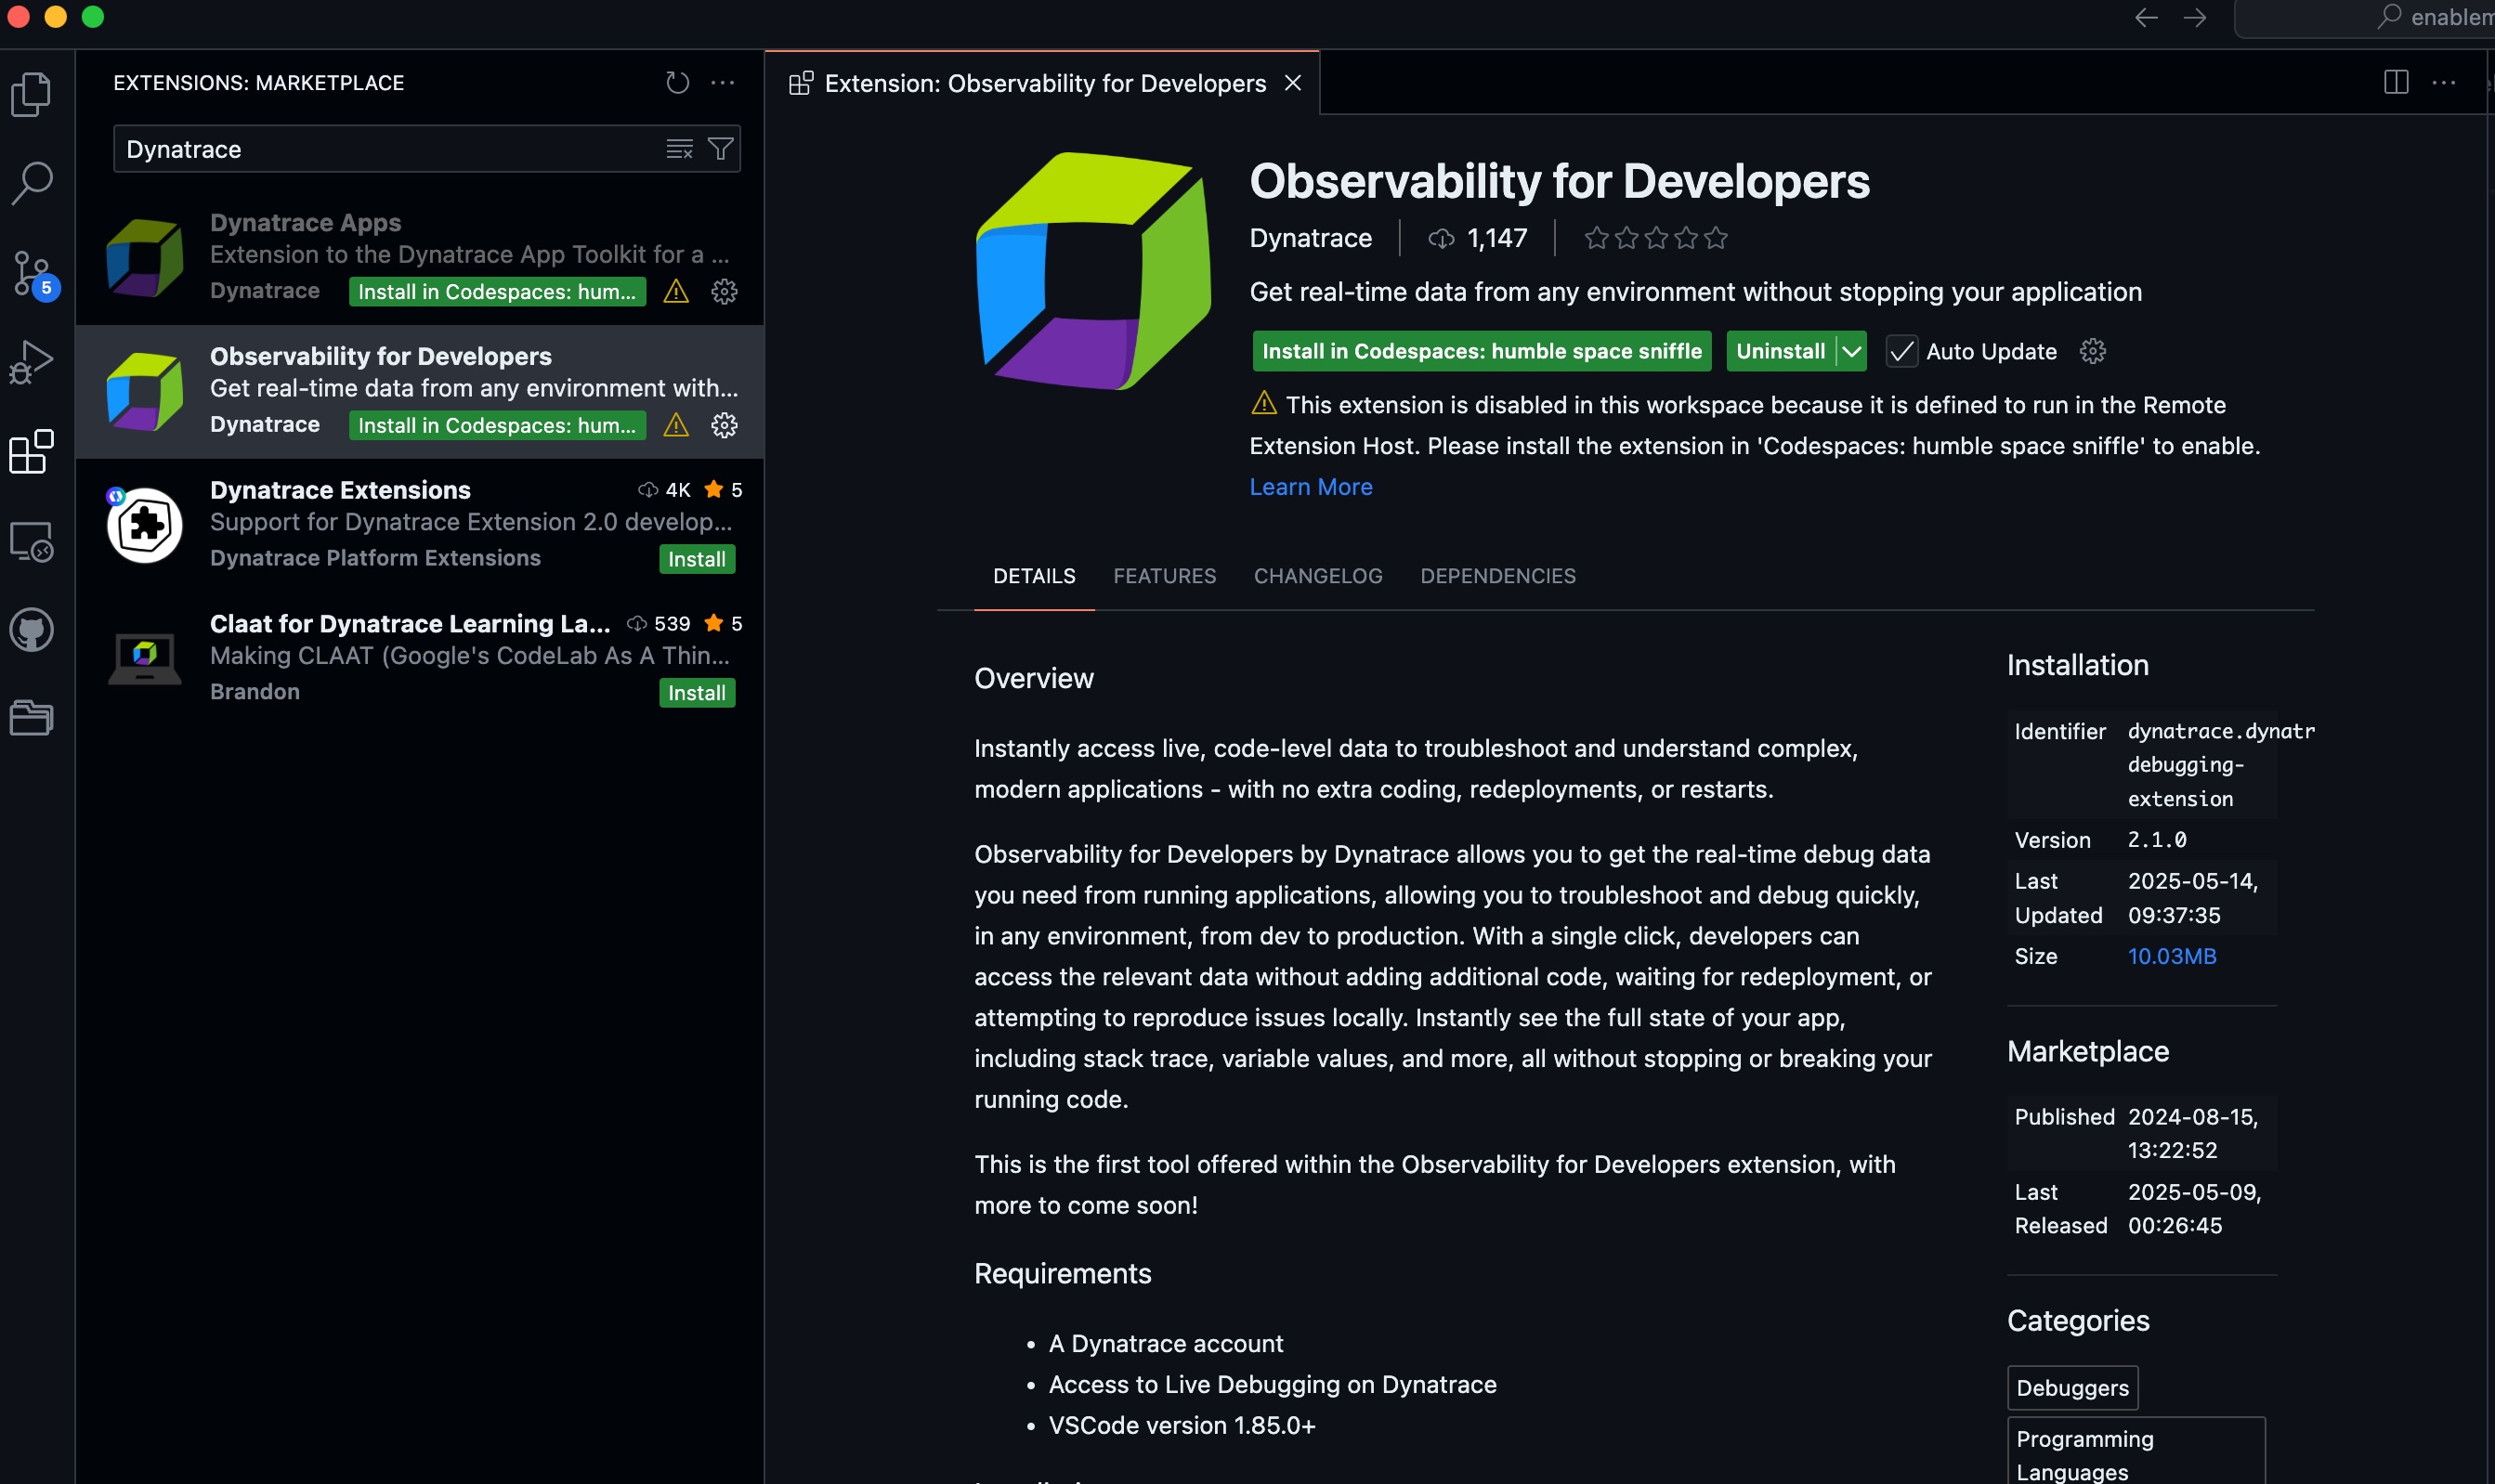
In your IDE, open Extensions, search for Dynatrace, select Observability for Developers, and install it.
Get VS Code Get the JetBrains plugin
Select the environment (DEV / sprint / production)#
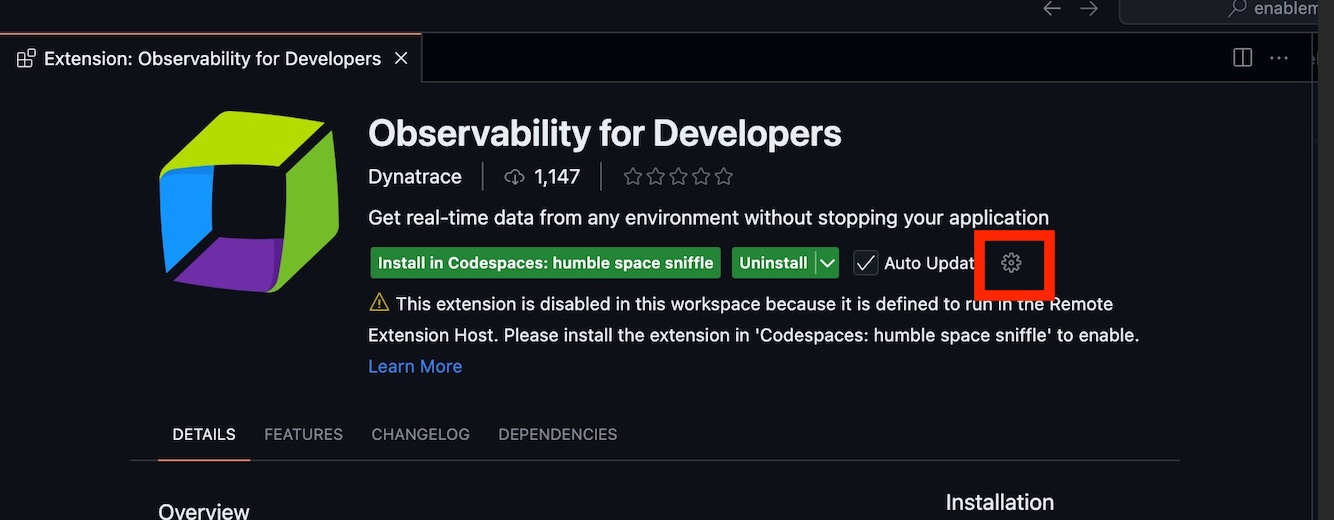
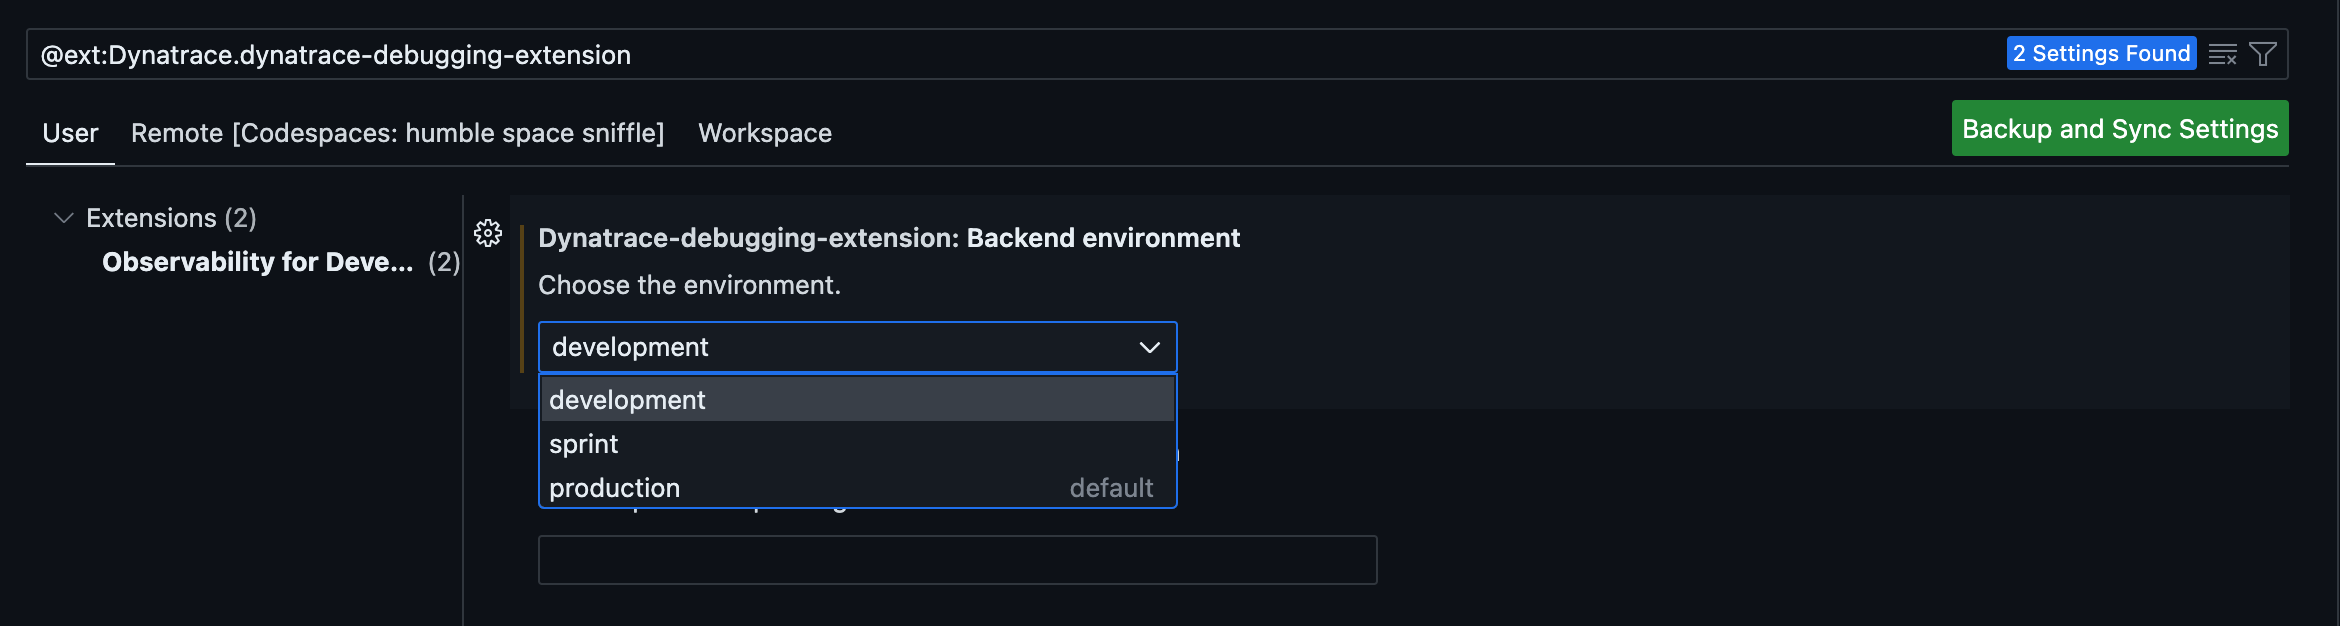
Most tenants run in production (the default — no change needed). Only if you use a DEV or sprint tenant: open the extension's settings wheel → Settings and choose the environment.
Options: development, sprint, production (default). You can set it per User, per Remote instance, and per Workspace.
Log in to Dynatrace via SSO#
In the bottom pane, open the Dynatrace Snapshots tab and click Log in. A browser opens, passes your SSO credentials back to the IDE, and you accept the connection.
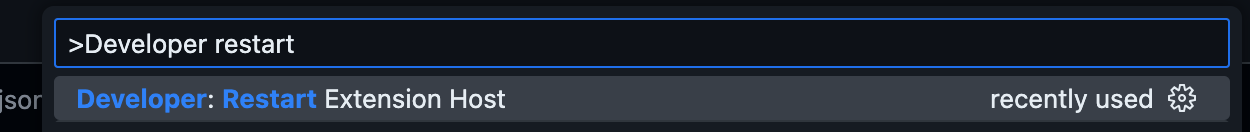
Login keeps loading — how to fix it
If the extension keeps loading after you log in, restart the extension host so it re-authenticates: [Ctrl]+[Shift]+P → Developer: Restart Extension Host.
Select the tenant ☁️#
Click the ☁️ cloud icon in the Dynatrace Snapshots tab and pick any tenant you have permission on.
Select a running container ✏️#
Click the ✏️ pencil icon to open Dynatrace: Instance selection. Select the todoapp-... pod and filter by k8s.workload.name:todoapp so the selection survives pod restarts and redeploys. Add k8s.namespace.name or cluster filters for larger environments.
Set a non-breaking breakpoint#
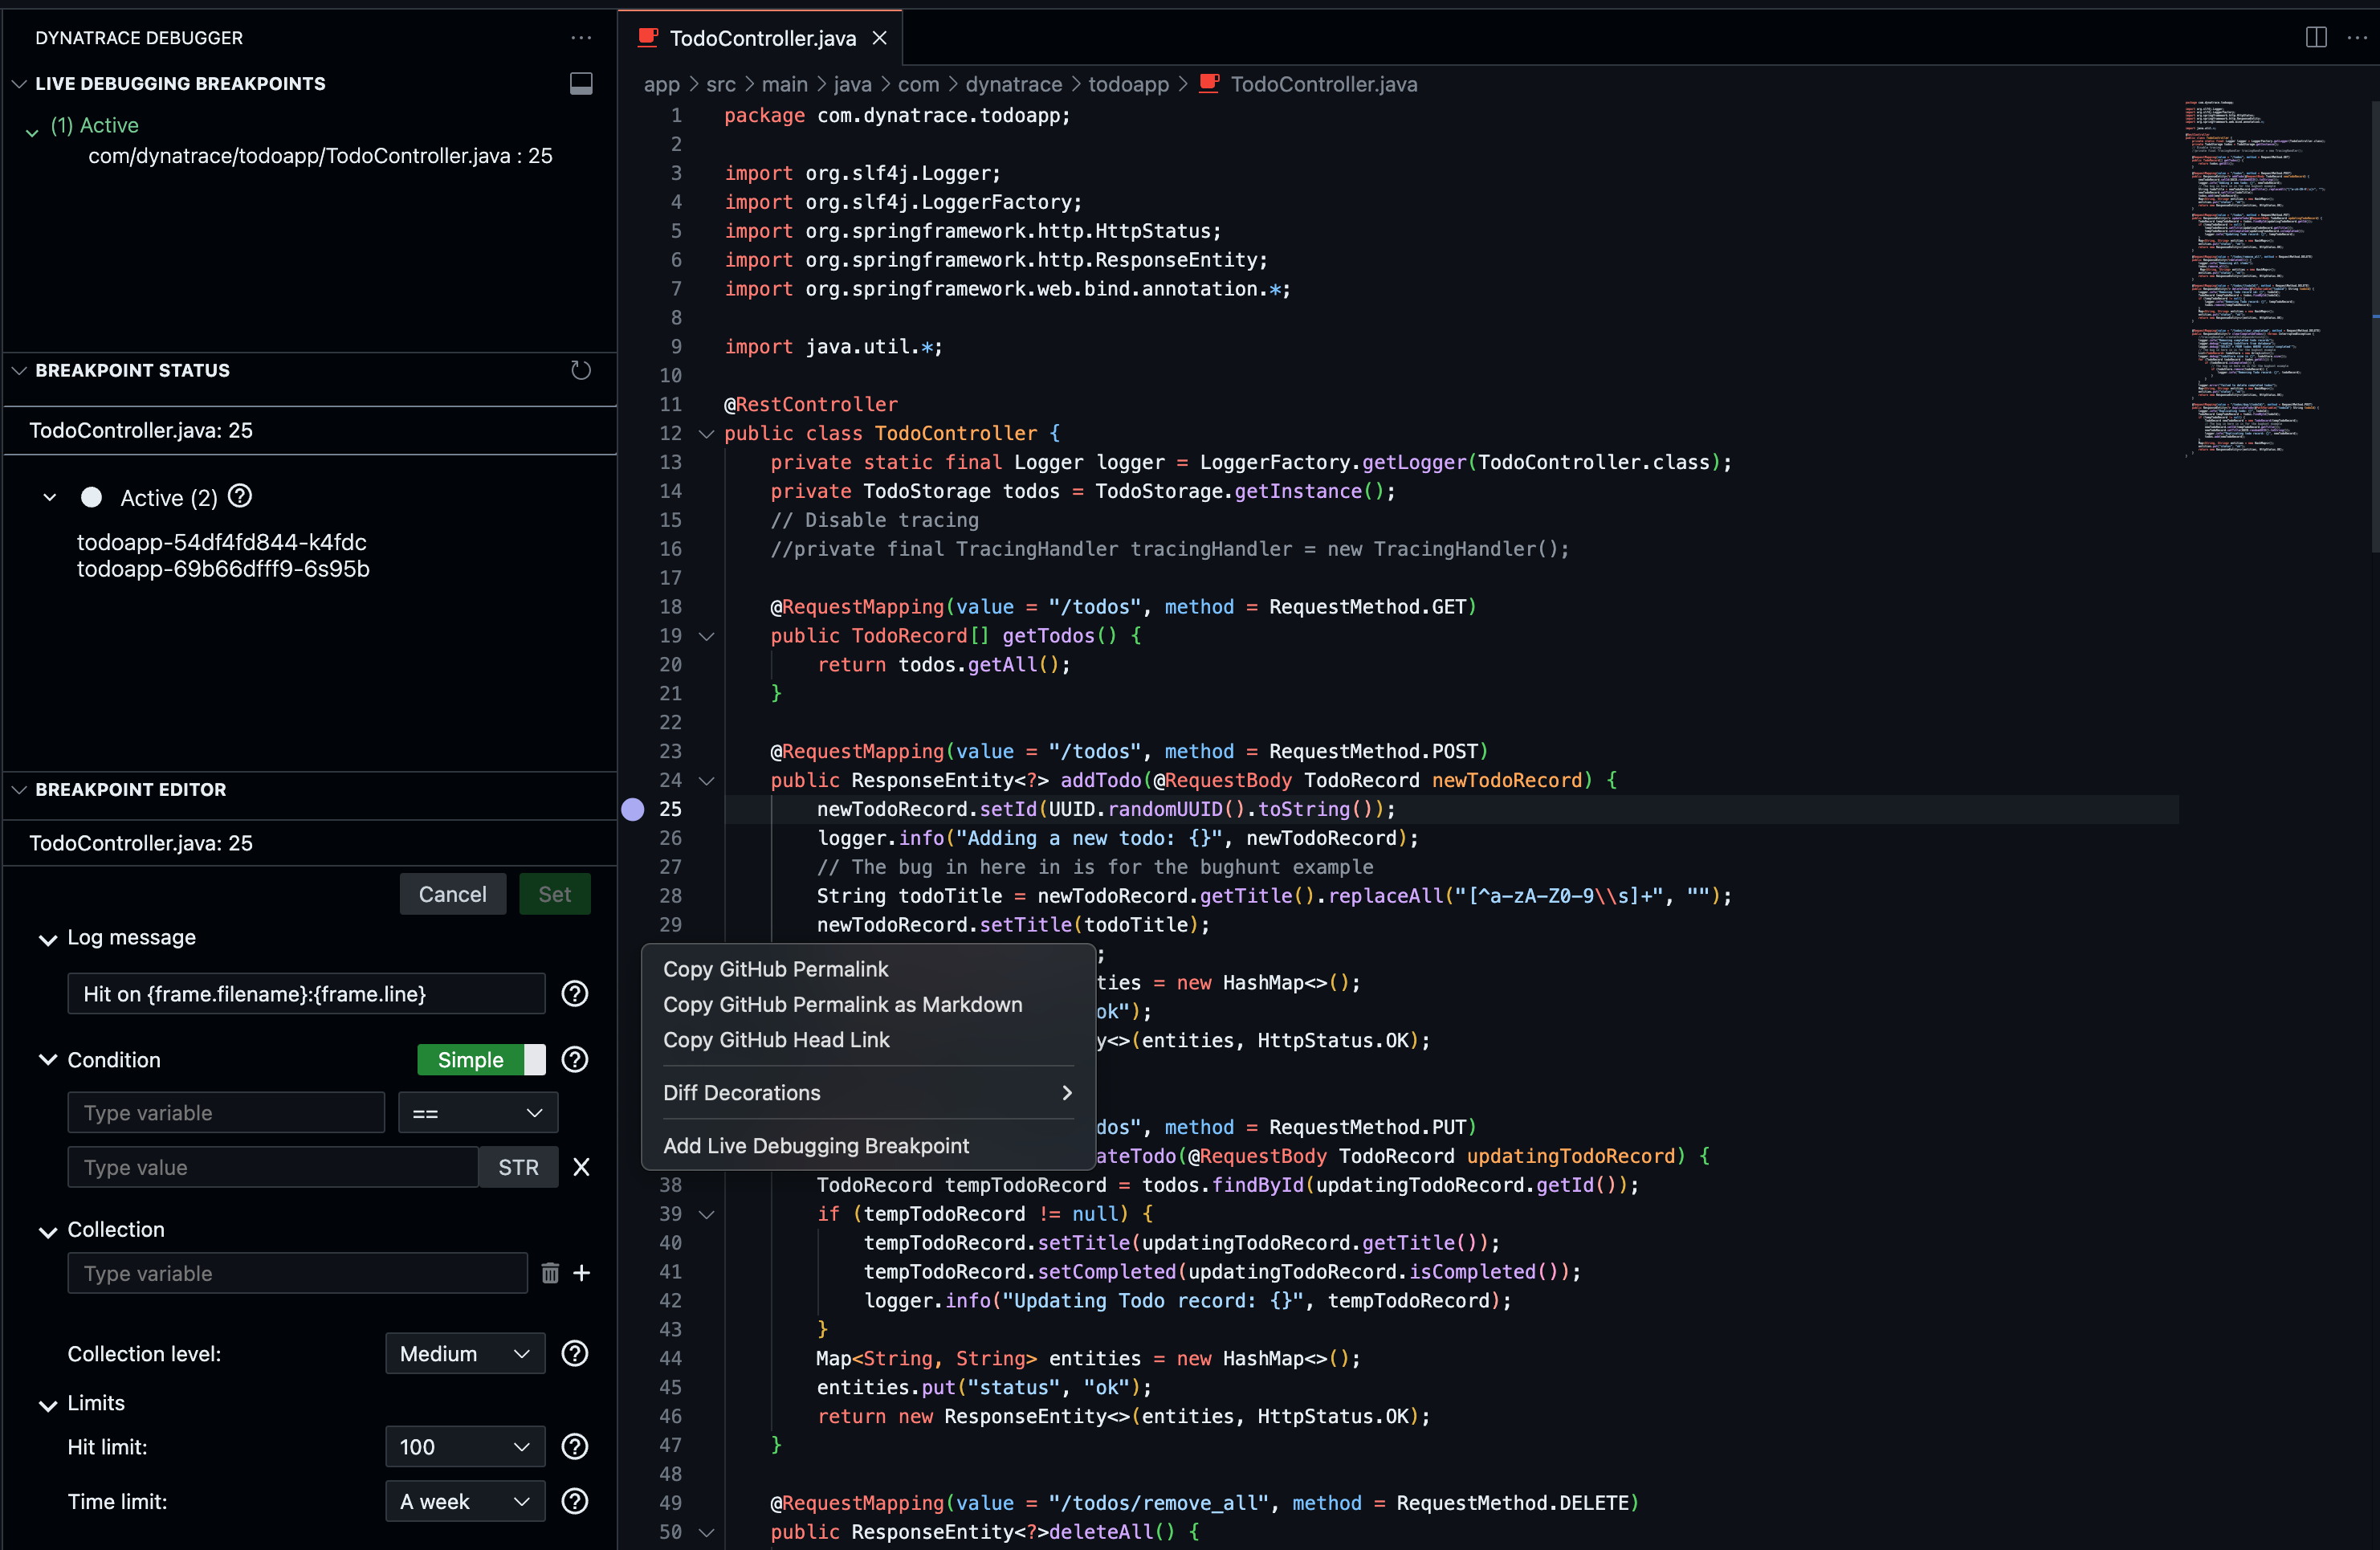
Open TodoController.java. On the line you want (e.g. line 25 inside addTodo), right-click the line number and choose Add Live Debugging breakpoint. The extension's left pane shows three sections:
| Pane | Description |
|---|---|
LIVE DEBUGGING BREAKPOINTS |
All active breakpoints with class and line number |
BREAKPOINT STATUS |
Status of each breakpoint and the instances it matches |
BREAKPOINT EDITOR |
Per-breakpoint settings: Log message, Conditions, Limits |