3. Codespaces
This Codespace leverages the Dynatrace Enablement Framework, providing a robust and flexible development environment. Key features include:
- Seamless operation within GitHub Codespaces, as a remote container, or locally via Docker.
- Cross-compilation support for both AMD and ARM architectures, ensuring broad compatibility.
- Adherence to industry standards and best practices to optimize the developer experience.
- Real-time observability of Kubernetes clusters using Dynatrace Full-Stack monitoring.
- Integrated Dynatrace MCP Server to deliver deep, actionable insights across distributed systems.
To learn more about the Dynatrace Enablement Framework and how it can enhance your development workflow, please refer to the official documentation
Create Codespace#
Click to open Codespaces for this lab repository:
![]()
Codespace Configuration
- Branch
- select the main branch
- Dev container configuration
- select Dynatrace Enablement Container
- Machine type
- select 4-core
- Region
- select any region, preferably one closest to your Dynatrace tenant
Wait for Codespace#
We know your time is very valuable. This codespace takes around 7-10 minutes to be fully operational. A local Kubernetes (k3d) cluster will be configured and in it a sample application, Astronomy Shop, will be deployed. To make your experience better, we are also installing and configuring tools like:
k9s kubectl helm node jq python3 gh
Explore Codespace#
Your Codespace has now deployed the following resources:
- A local Kubernetes (k3d) cluster, with some pre-deployed apps that will be used later in the demo.
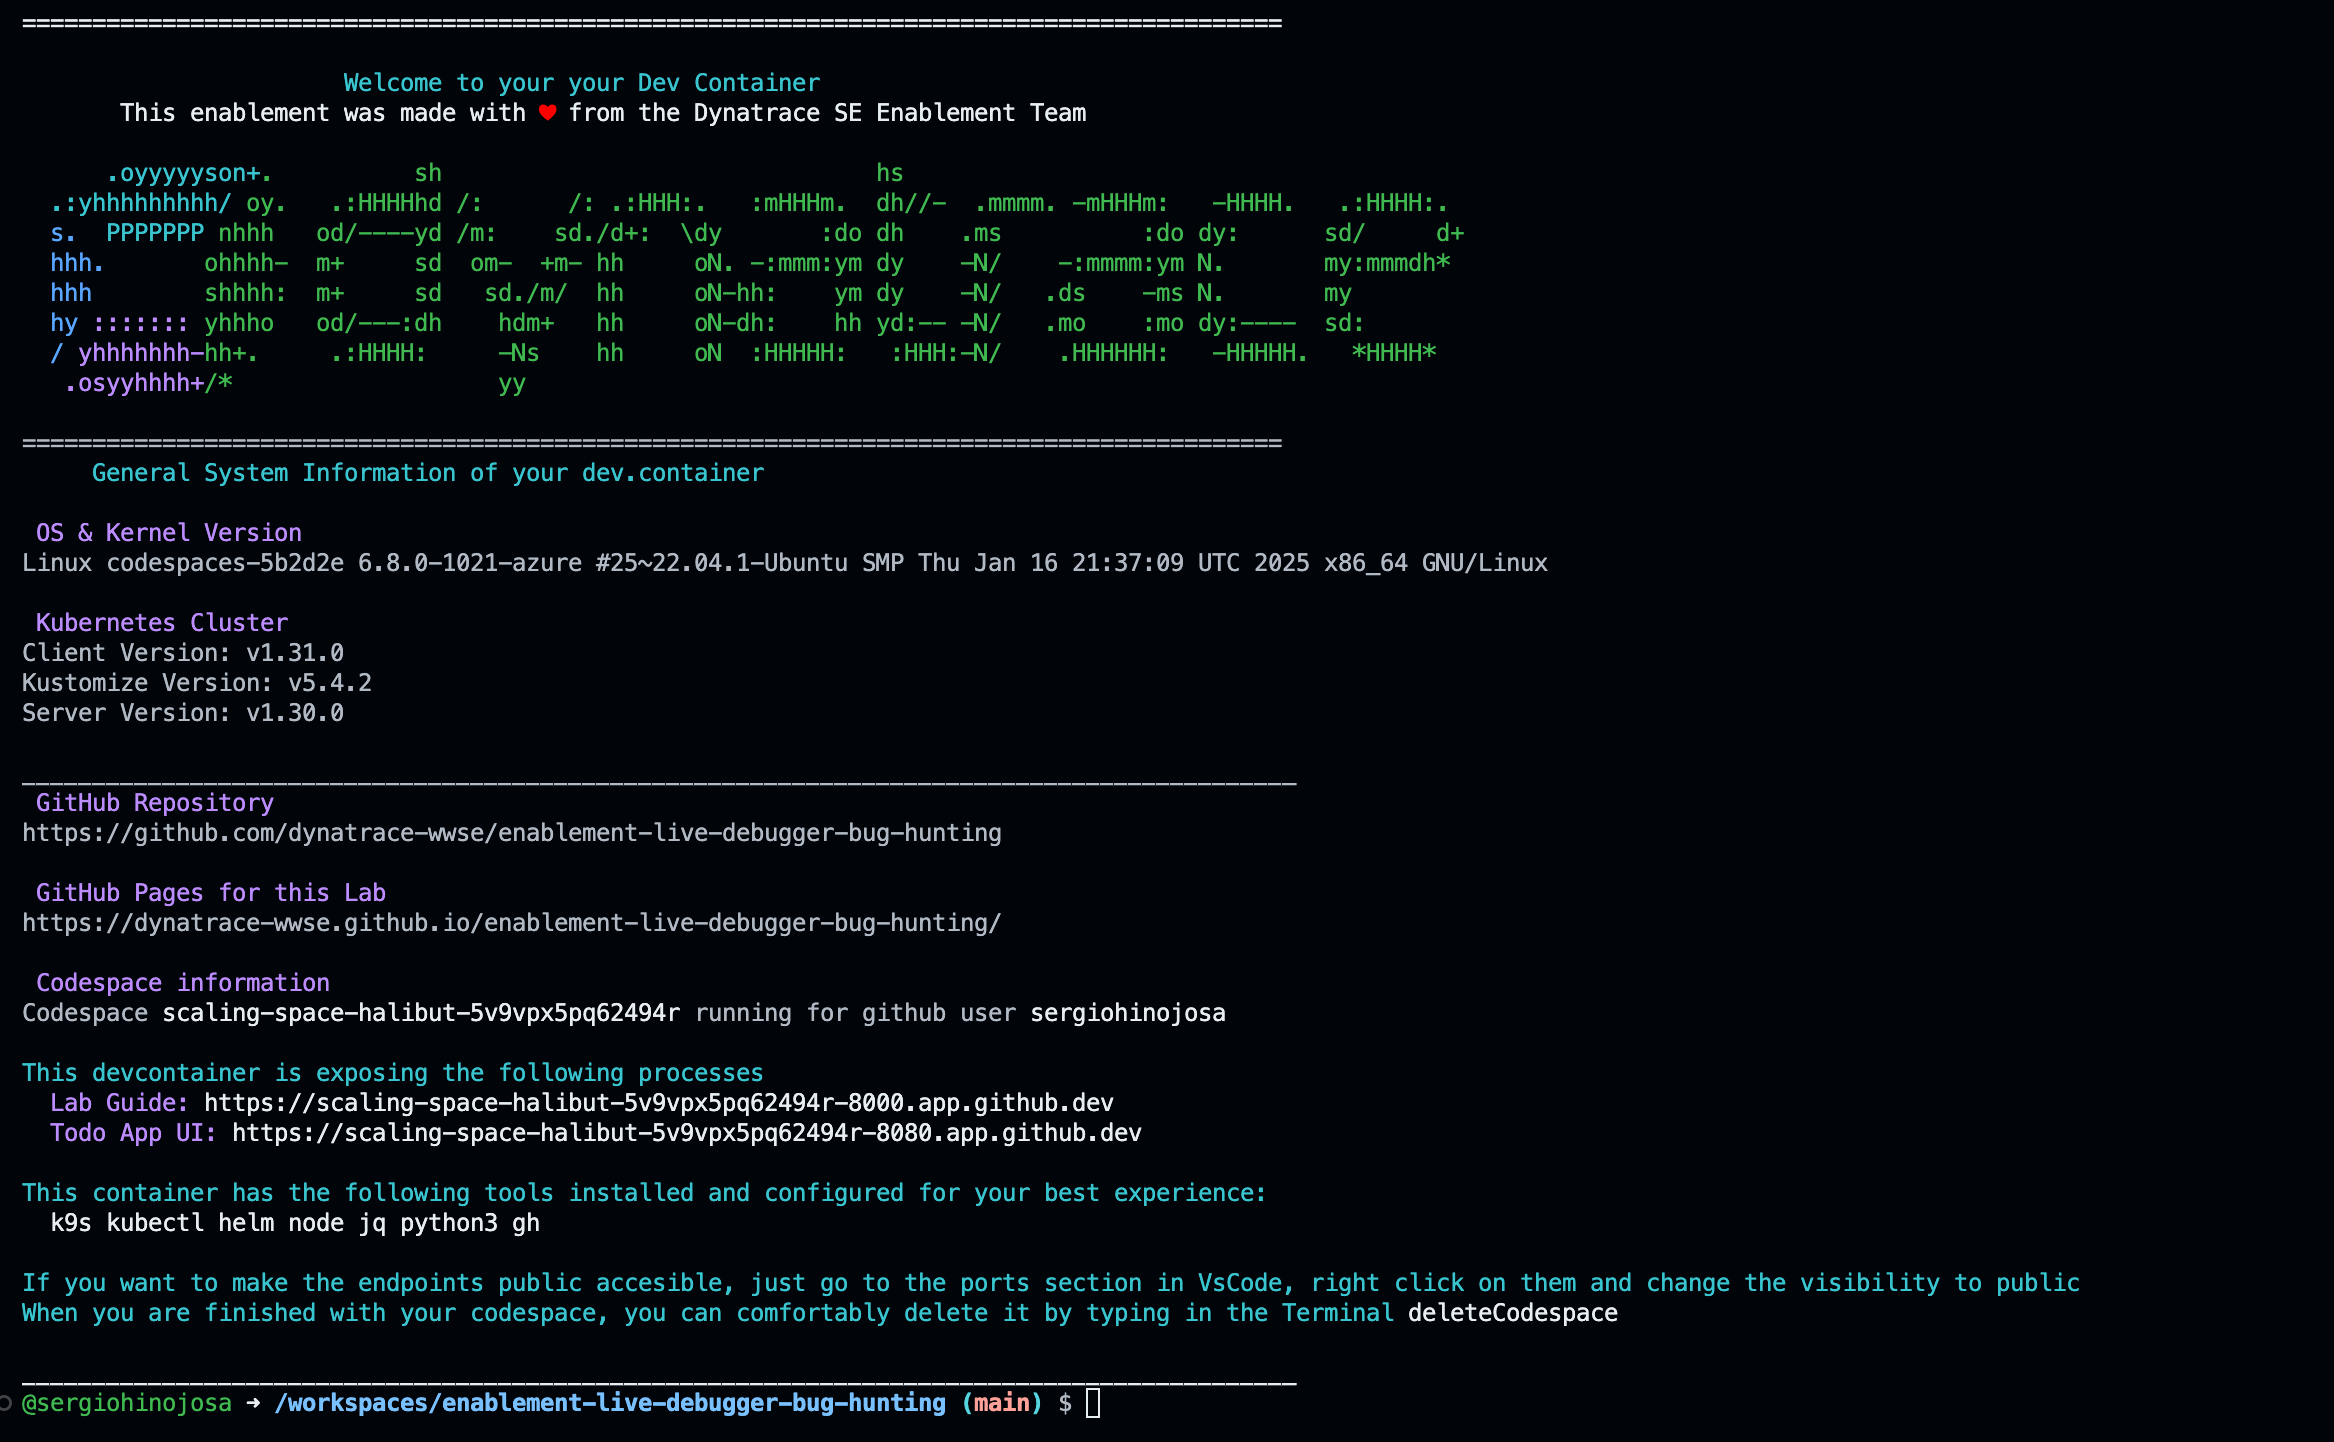
After a couple of minutes, you'll see this screen in your Codespaces terminal. It contains the links to the UI of the application which we will be using for our hands-on training.
Sample output:
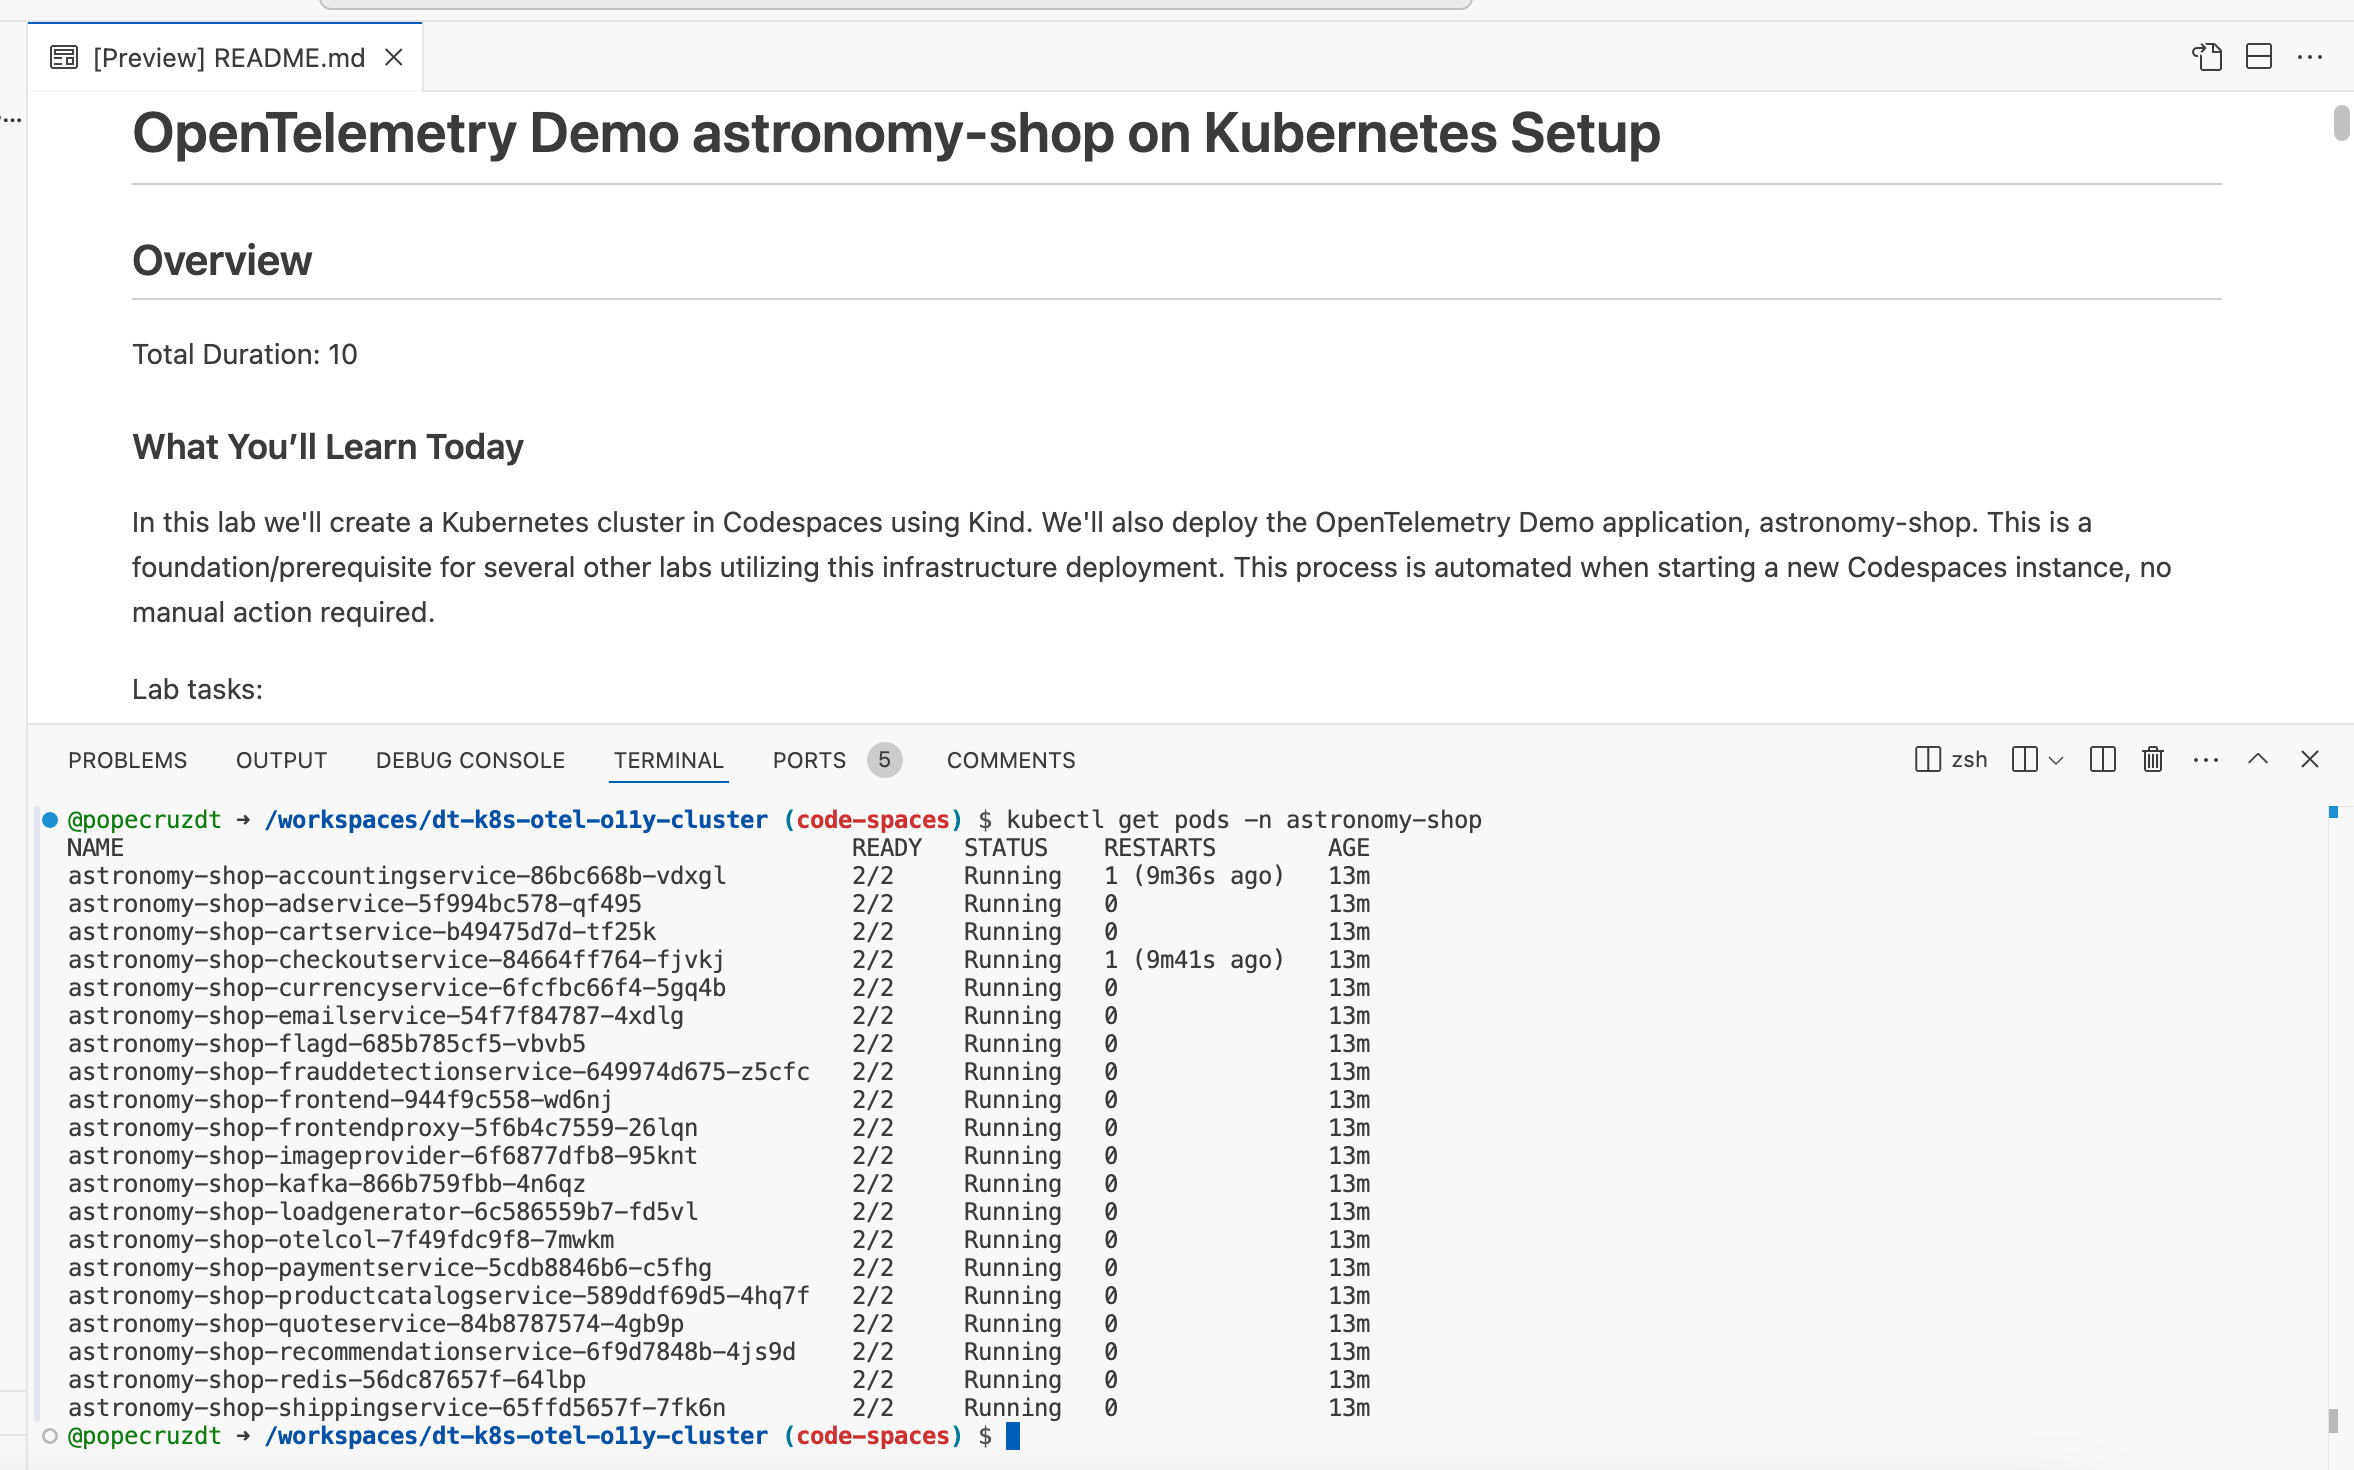
Validate Astronomy Shop#
When the Codespace instance is idle, validate the astronomy-shop pods are running.
Command:
Tips & Tricks#
We want to boost your learning and try to make your experience as smooth as possible with Dynatrace trainings. Your Codespaces have a couple of convenience features added.
Show the greeting#
In the terminal, there are functions loaded for your convenience. By creating a new terminal the greeting will be shown that includes the links to the exposed apps, the Github pages, the Github Repository, the Dynatrace Tenant that is bound to this devcontainer (if applicable) and some of the tools installed.
You can create a new terminal directly in VSCode, type zsh or call the function printGreeting and that will print the greeting with the most relevant information.
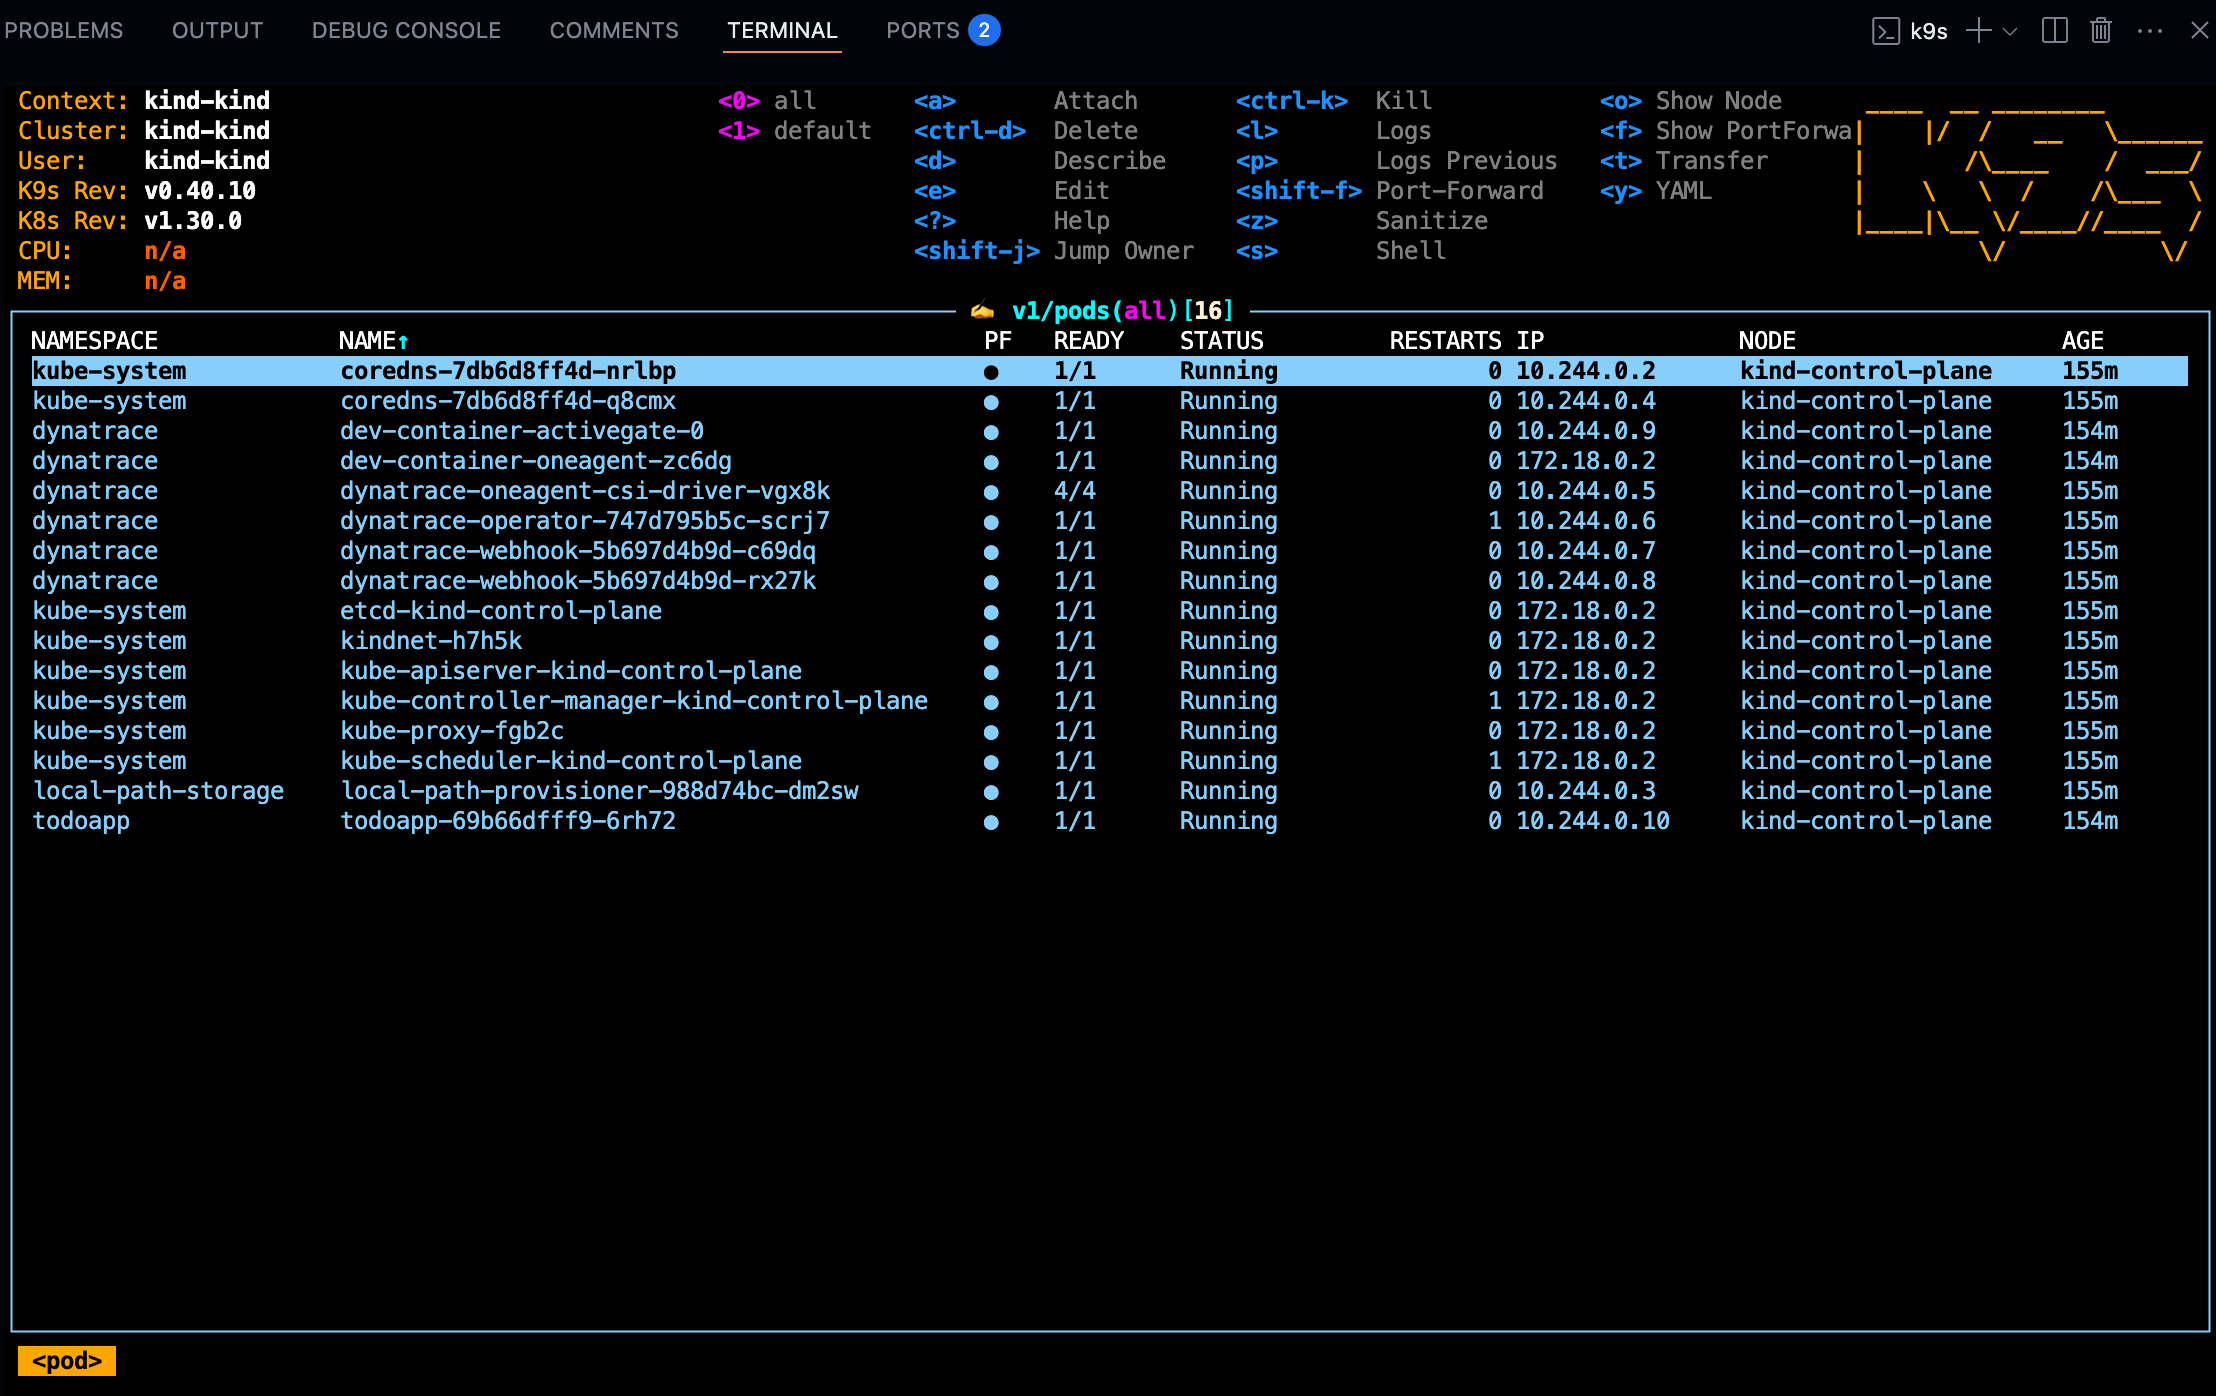
Navigating in your local Kubernetes#
The client kubectl and k9s are configured so you can navigate in your local Kubernetes.
Troubleshooting#
Astronomy Shop#
If you encounter problems with the Astronomy Shop app deployed in the astronomy-shop namespace, you can easily recycle the pods.
Recycle pods:
But before doing so, if you want to see what is happening we recommend the following:
Verify all astronomy-shop pods
Check for events in the astronomy-shop namespace
Check for system and cluster events
App exposure#
The astronomy-shop application is accessible via the nginx ingress controller. The URL is shown in the greeting — run printGreeting to display it.
Verify service:
Problem Patterns#
The Astronomy Shop demo application provides several feature flags that you can use to simulate different scenarios. These flags are managed by flagd, a simple feature flag service that supports OpenFeature. However, this release of Astronomy Shop does not include the flagd-ui component, so feature flags must be set by updating the flagd ConfigMap.
PaymentServiceFailure#
Payment transaction failures that result in the inability for orders to be placed, can be turned on using the paymentServiceFailure feature flag. There is a helper function to enable the flag and an additional helper function to disable the flag. Ignore any warnings from kubectl about missing annotations.
Enable function:
Disable function:
Finish Codespace Setup#
Define workshop user variables#
In your Github Codespaces Terminal set the environment variables:
Sprint Environment
Are you using a Sprint environment for your Dynatrace tenant? If so, then use export DT_ENDPOINT=https://{your-environment-id}.sprint.dynatracelabs.com/api/v2/otlp instead of the live version below.
export DT_ENDPOINT=https://{your-environment-id}.live.dynatrace.com/api/v2/otlp
export DT_API_TOKEN={your-api-token}
export NAME=<INITIALS>-k8s-otel-o11y
Deploy OpenTelemetry Operator#
Move to the base directory
Command:
Sample output:/workspaces/enablement-kubernetes-opentelemetry
You should find yourself at the base directory of the repository. If not, then navigate to it.
Create dynatrace namespace
Create the dynatrace namespace. This is where we'll deploy the OpenTelemetry Collectors.
Command:
Sample output:
Create dynatrace-otelcol-dt-api-credentials secret
The secret holds the API endpoint and API token that OpenTelemetry data will be sent to.
Command:
kubectl create secret generic dynatrace-otelcol-dt-api-credentials --from-literal=DT_ENDPOINT=$DT_ENDPOINT --from-literal=DT_API_TOKEN=$DT_API_TOKEN -n dynatrace
Deploy cert-manager, pre-requisite for opentelemetry-operator
Command:
Sample output:
namespace/cert-manager created\ customresourcedefinition.apiextensions.k8s.io/certificaterequests.cert-manager.io created\ customresourcedefinition.apiextensions.k8s.io/certificates.cert-manager.io created\ ...\ validatingwebhookconfiguration.admissionregistration.k8s.io/cert-manager-webhook created
Wait 30-60 seconds for cert-manager to finish initializing before continuing.
Deploy opentelemetry-operator
The OpenTelemetry Operator will deploy and manage the custom resource OpenTelemetryCollector deployed on the cluster.
Command:
Sample output:
namespace/opentelemetry-operator-system created\ customresourcedefinition.apiextensions.k8s.io/instrumentations.opentelemetry.io created\ customresourcedefinition.apiextensions.k8s.io/opampbridges.opentelemetry.io created\ ...\ validatingwebhookconfiguration.admissionregistration.k8s.io/opentelemetry-operator-validating-webhook-configuration configured
Wait 30-60 seconds for opentelemetry-operator-controller-manager to finish initializing before continuing.
Validate that the OpenTelemetry Operator components are running.
Command:
Sample output:
| NAME | READY | STATUS | RESTARTS | AGE |
|---|---|---|---|---|
| opentelemetry-operator-controller-manager-5d746dbd64-rf9st | 2/2 | Running | 0 | 1m |
Continue#
In the next section, we'll ship logs from Kubernetes to Dynatrace using OpenTelemetry.