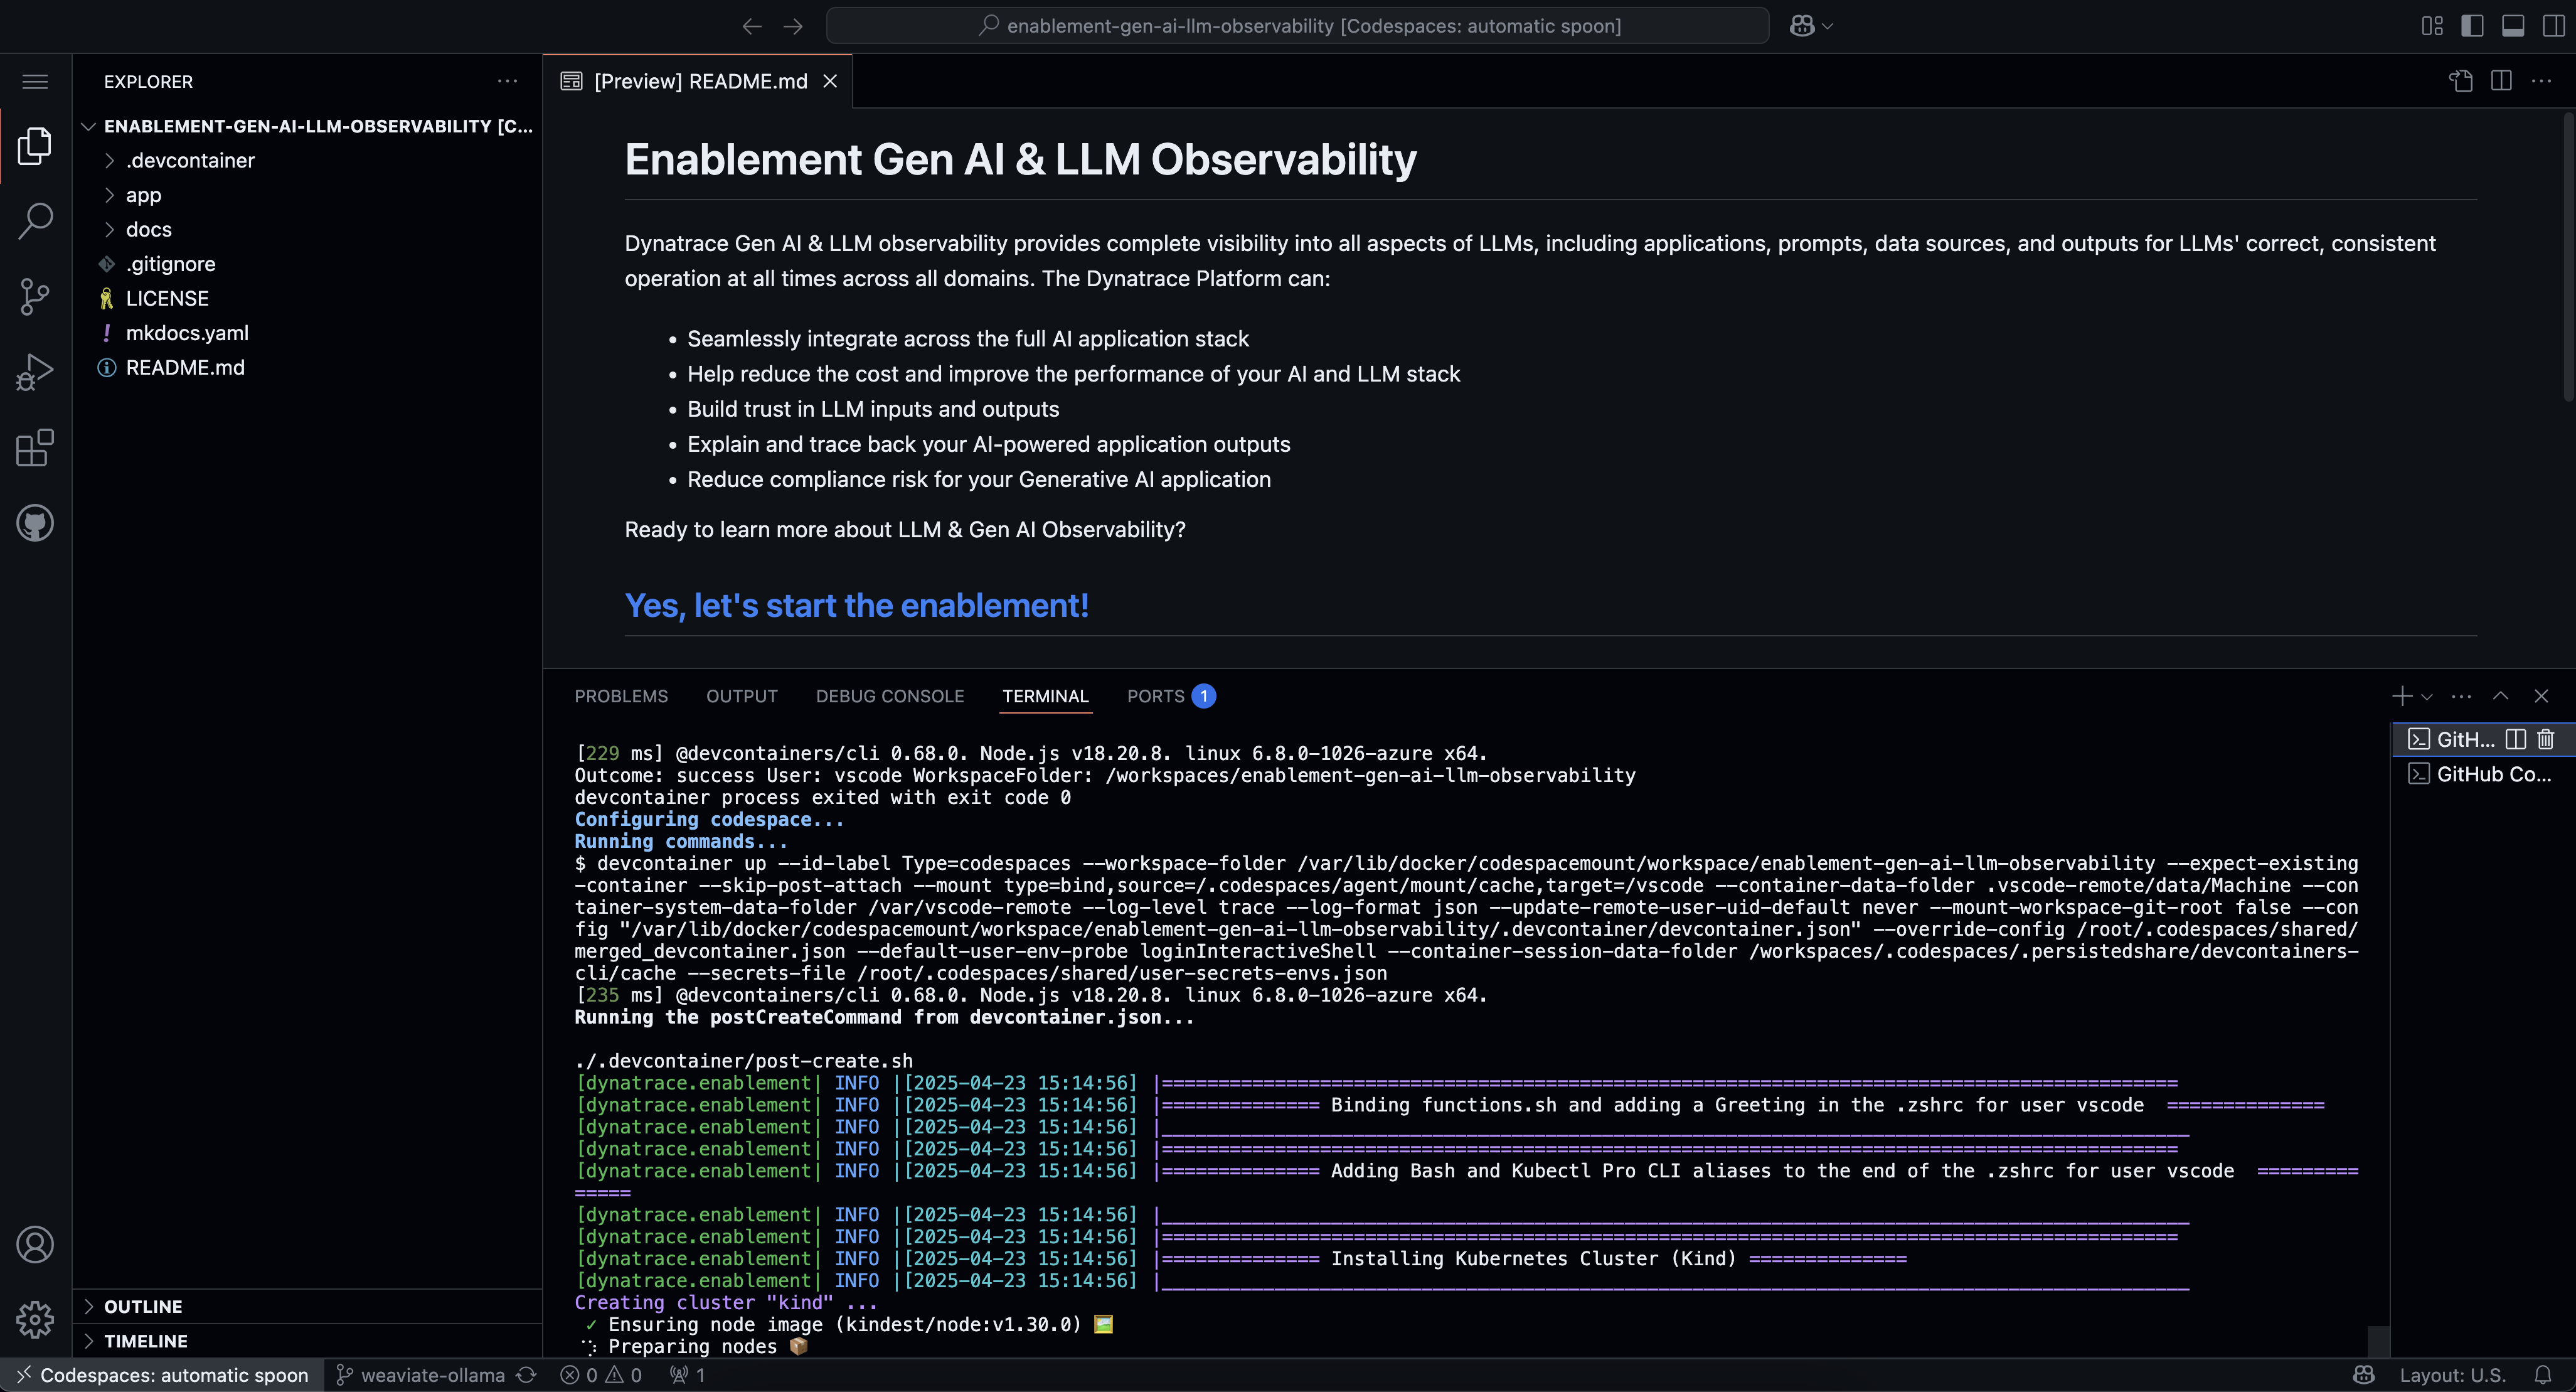
3. Codespaces
This Codespace leverages the Dynatrace Enablement Framework, providing a robust and flexible development environment. Key features include:
- Seamless operation within GitHub Codespaces, as a remote container, or locally via Docker.
- Cross-compilation support for both AMD and ARM architectures, ensuring broad compatibility.
- Adherence to industry standards and best practices to optimize the developer experience.
- Real-time observability of Kubernetes clusters using Dynatrace Full-Stack monitoring.
- Integrated Dynatrace MCP Server to deliver deep, actionable insights across distributed systems.
To learn more about the Dynatrace Enablement Framework and how it can enhance your development workflow, please refer to the official documentation
![]()
1.1 Codespaces configuration#
Branch, Machine sizing & secrets
- Branch
- select the main branch
- Machine sizing
- As a machine type select 4-core
- Secrets (enter your credentials within the following variables)
- DT_ENVIRONMENT
- DT_LLM_TOKEN
2. While the Codespace is set-up for you, learn powerful usecases with Dynatrace#
We know your time is very valuable. This codespace takes around 6 minutes to be fully operational. A local Kubernetes (k3d) cluster monitored by Dynatrace will be configured and in it a sample AI application, the AI Travel Advisor app will be deployed. To make your experience best, we are also installing and configuring tools like:
k9s kubectl helm node jq python3 gh
3. Explore what has been deployed#
Your Codespace has now deployed the following resources:
-
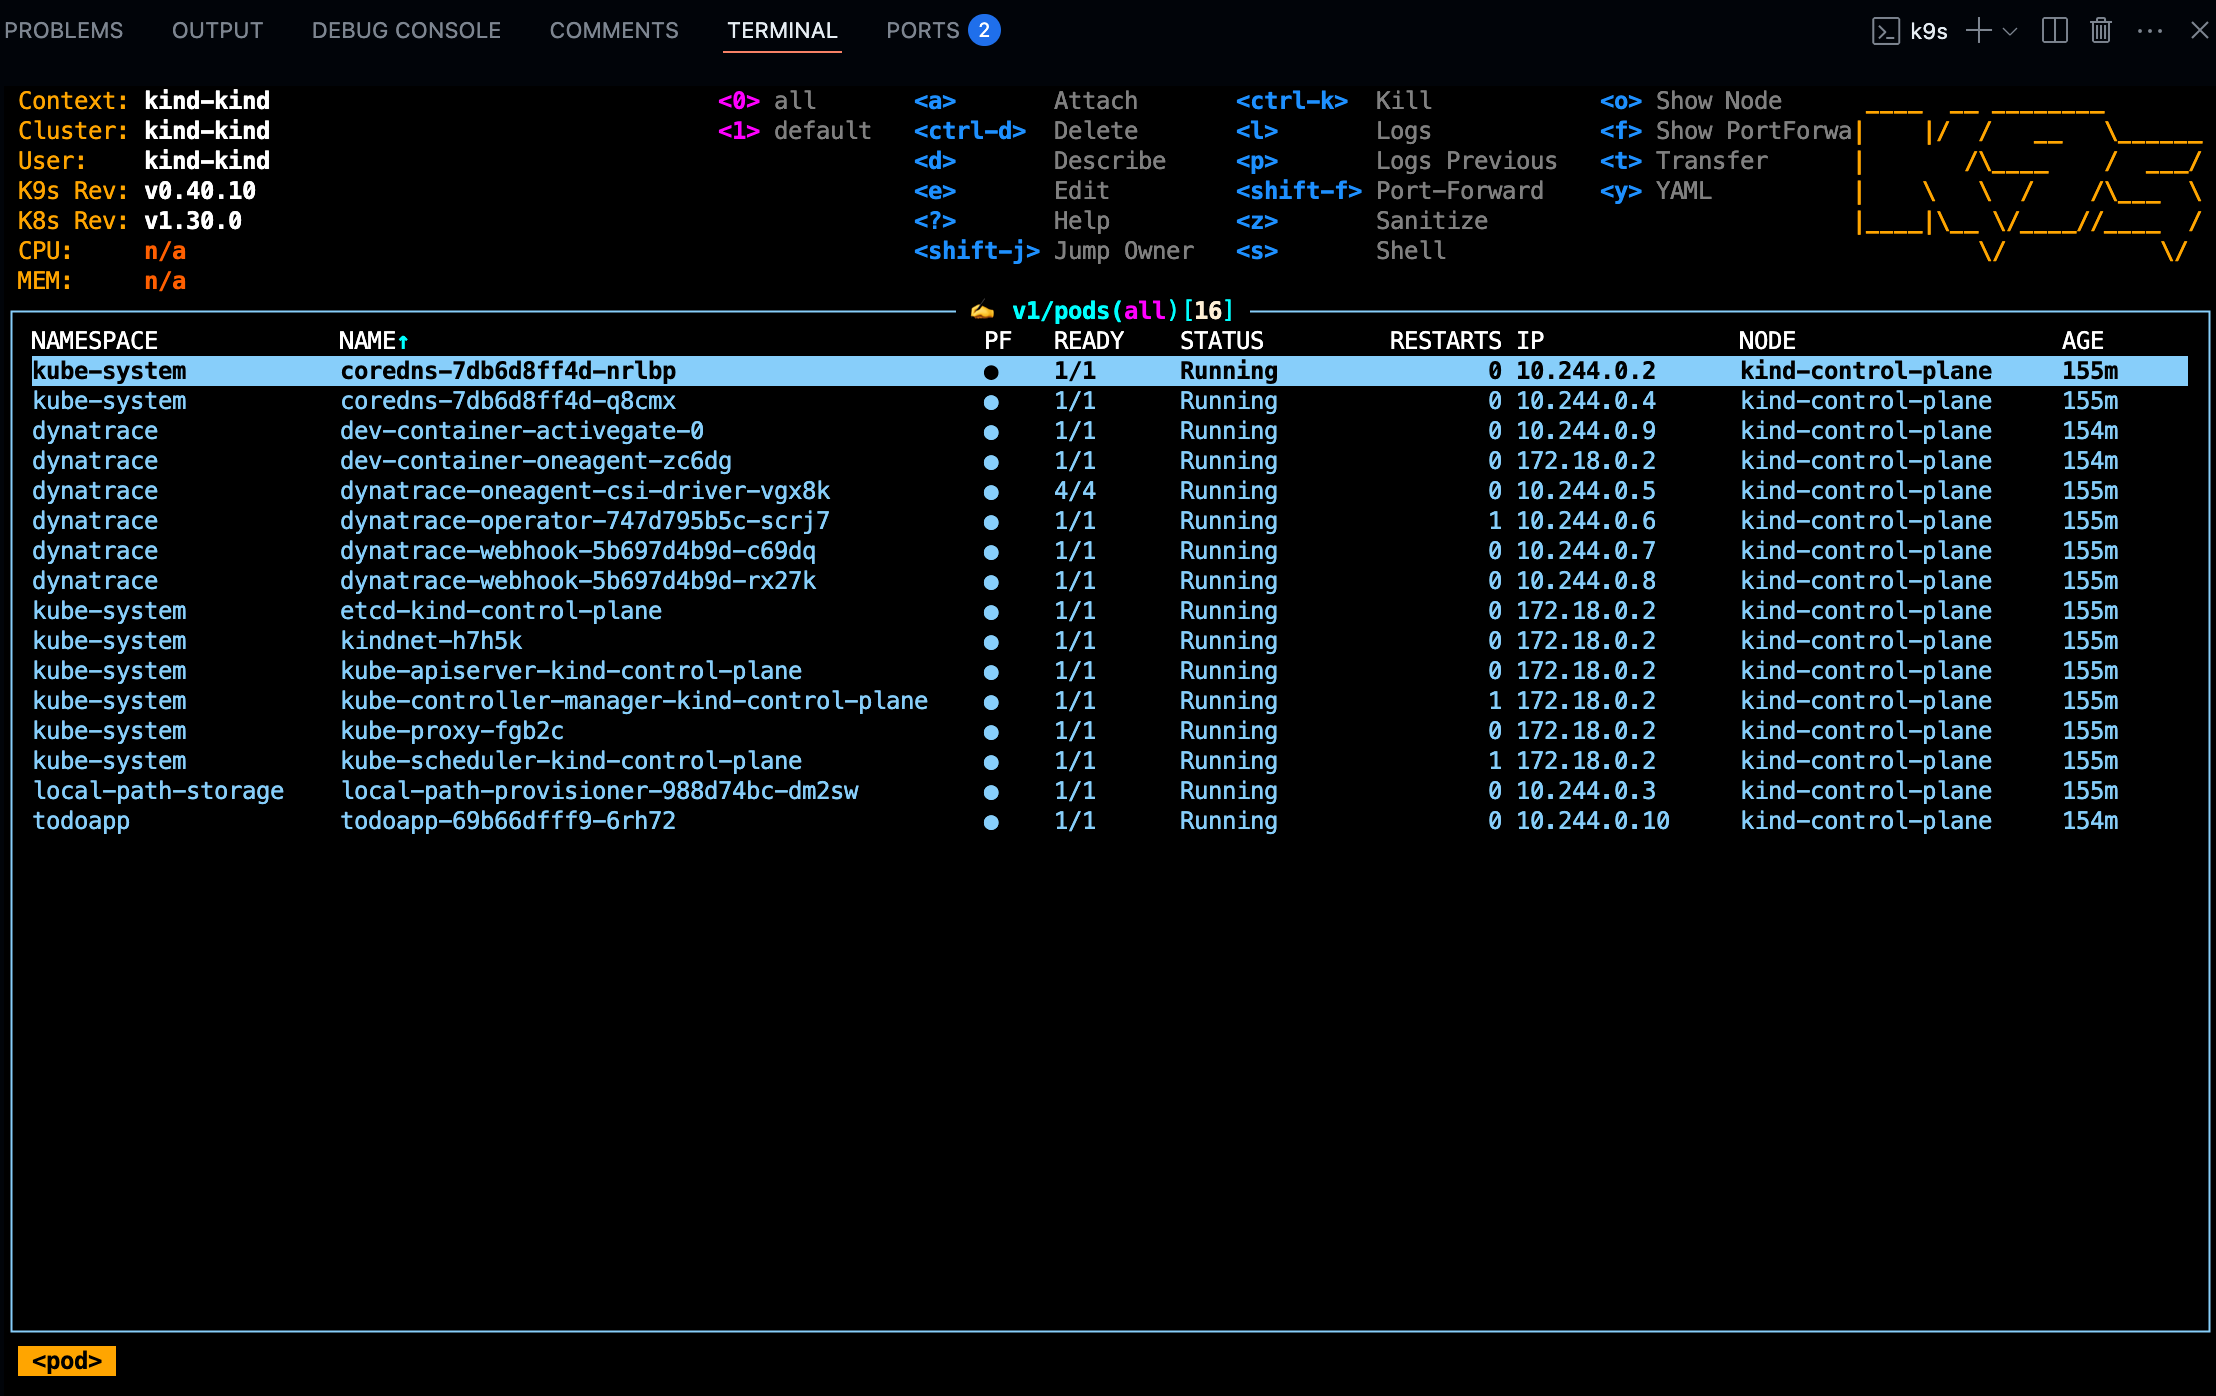
A local Kubernetes (k3d) cluster monitored by Dynatrace, with some pre-deployed apps that will be used later in the demo.
-
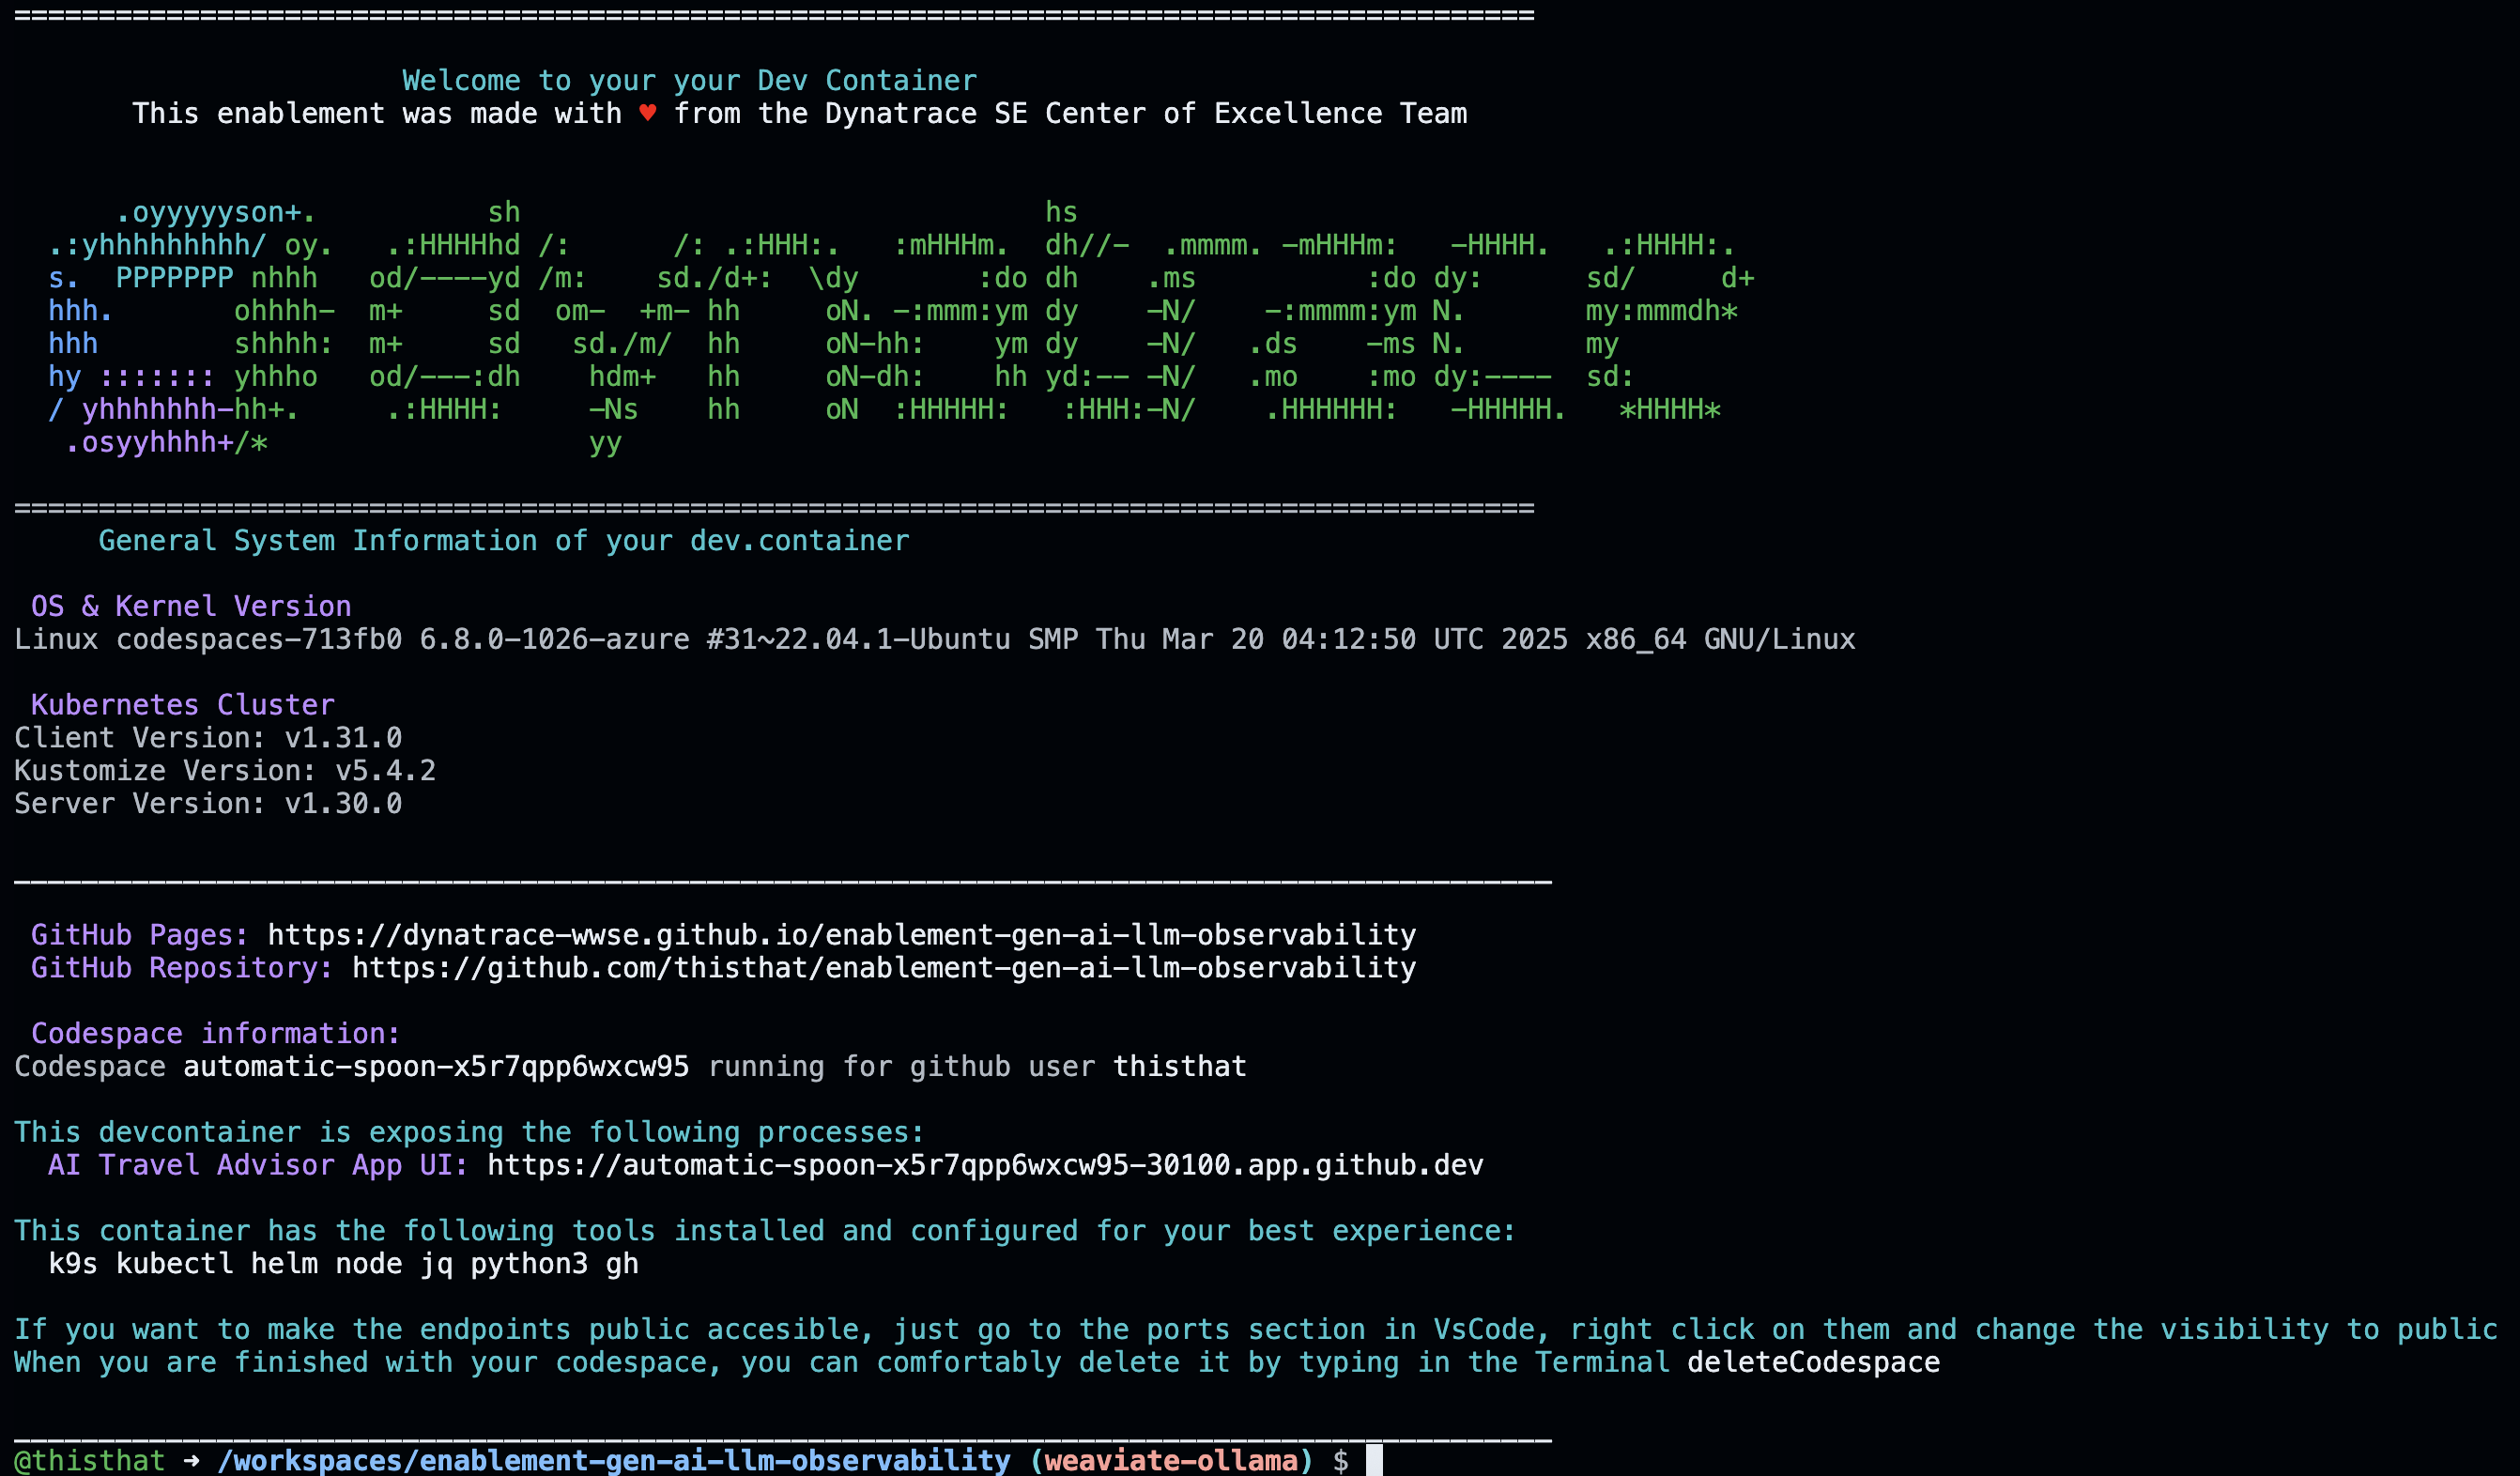
After a couple of minutes, you'll see this screen in your codespaces terminal. It contains the links to the local expose labguide and the UI of the application which we will be doing our Hands-On training.
4. Tips & Tricks#
We want to boost your learning and try to make your DEV experience as smooth as possible with Dynatrace trainings. Your Codespaces have a couple of convenience features added.
Show the greeting#
In the terminal, there are functions loaded for your convenience. By creating a new Terminal the Greeting will be shown that includes the links to the exposed apps, the Github pages, the Github Repository, the Dynatrace Tenant that is bound to this devcontainer and some of the tools installed.
You can create a new Terminal directly in VSCode, type zsh or call the function printGreeting and that will print the greeting with the most relevant information.
Navigating in your local Kubernetes#
The client kubectl and k9sare configured so you can navigate in your local Kubernetes like butter.
Exposing the app to the public#
The AI Travel Advisor app is accessible via the nginx ingress controller. The URL is shown in the greeting — run printGreeting to display it. You can also make endpoints publicly accessible from VS Code's Ports panel.
5. Troubleshooting#
Exposing the App#
The AI Travel Advisor app is accessible via the nginx ingress controller. The URL is shown in the greeting — run printGreeting in the terminal to display it. You can see all exposed ports by typing showOpenPorts.