Analyze Logs#
Enable Astroshop Problem Patterns#
The astroshop demo provides several feature flags that you can use to simulate different scenarios. These flags are managed by flagd, a simple feature flag service that supports OpenFeature.
Flag values can be changed through the feature flag UI — open the Astroshop URL from the greeting (printGreeting) and append /feature. Changing the values through this user interface will be reflected in the flagd service.
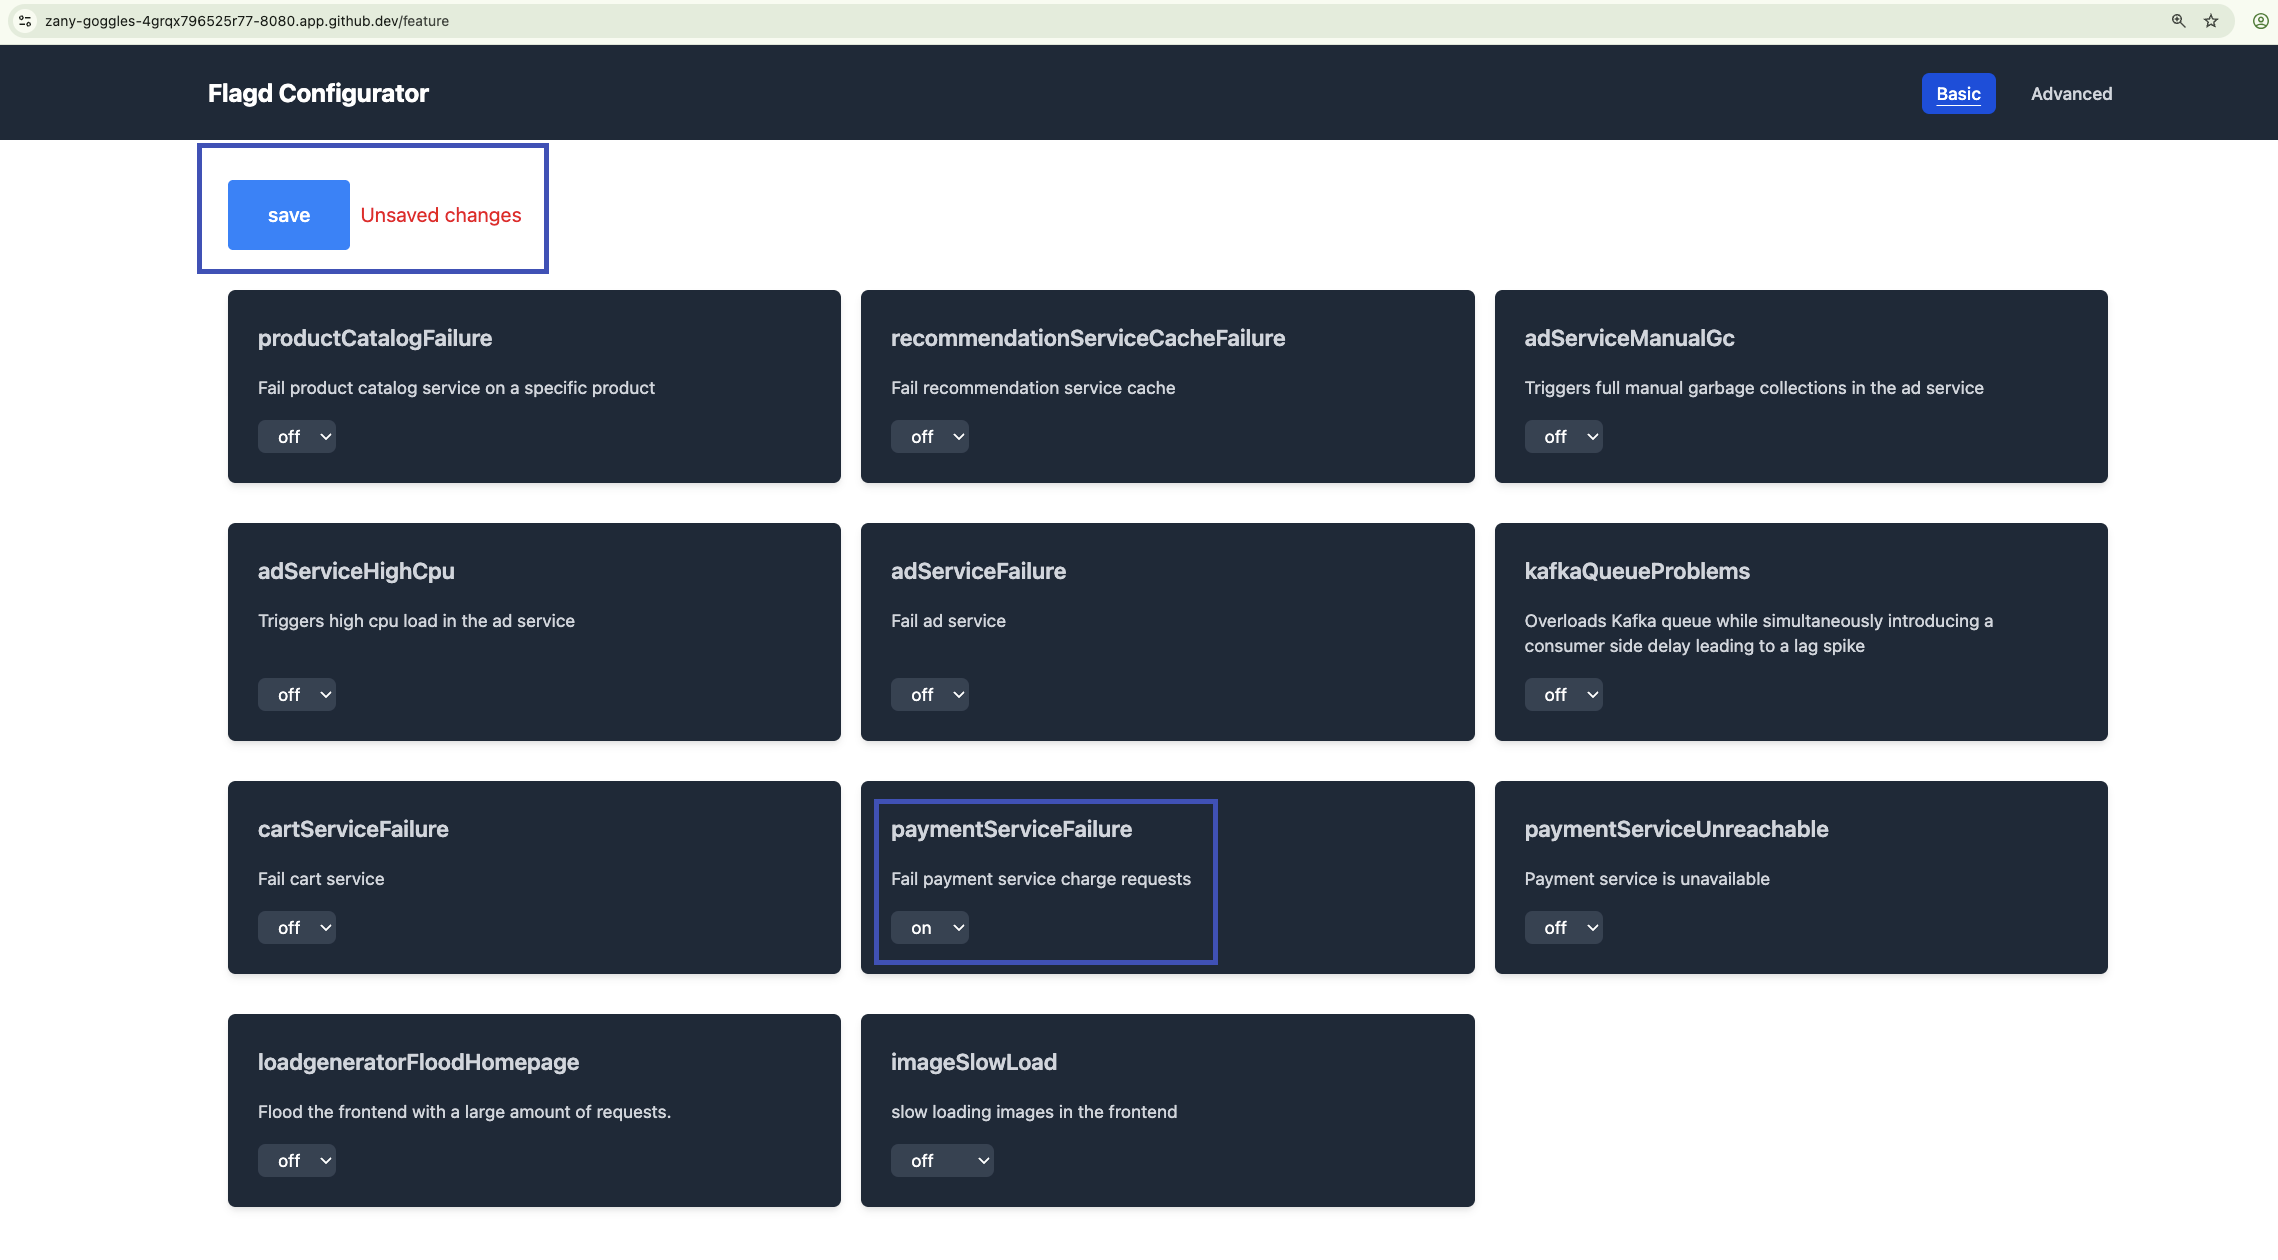
Navigate to the feature flag UI by adding /feature to the end of your AstroShop app URL.
Locate the flag paymentFailure. Click the drop down box and change it from off to a percentage, in this case we are choosing 50%. Click save at the top of the page. The feature flag should start working within a minute.
Once the flag is on, the payment service starts throwing errors. Confirm the failing payment logs are reaching Dynatrace before you investigate them.
Analyze Logs in Context#
Modern applications run in distributed environments. They generate observability data like metrics, logs and traces. Having all data in one place is often not enough because manual correlation can be required. Understanding the behavior and performance of distributed applications is important for effective troubleshooting. Dynatrace automatically connects and puts data in context for a smooth troubleshooting and analytics experience. This automated approach not only streamlines troubleshooting but also enhances the overall analytics experience, enabling teams to optimize application performance with ease.
Shortly after enabling the feature flag for paymentServiceFailure, the Payment Service should start to fail every single payment transaction. Let's observe, using logs in context, the impact on application reliability of this change.
Problems App#
Start by opening the Problems app. By now, Dynatrace should have detected a problem with the Payment Service through the ingested log records. Locate the problem and open it to view the details.
Notice the logs in context callout on the top right of the frame. Dynatrace automatically searches for logs related to the entities that are root cause relevant. Click on Run query to query the relevant logs.
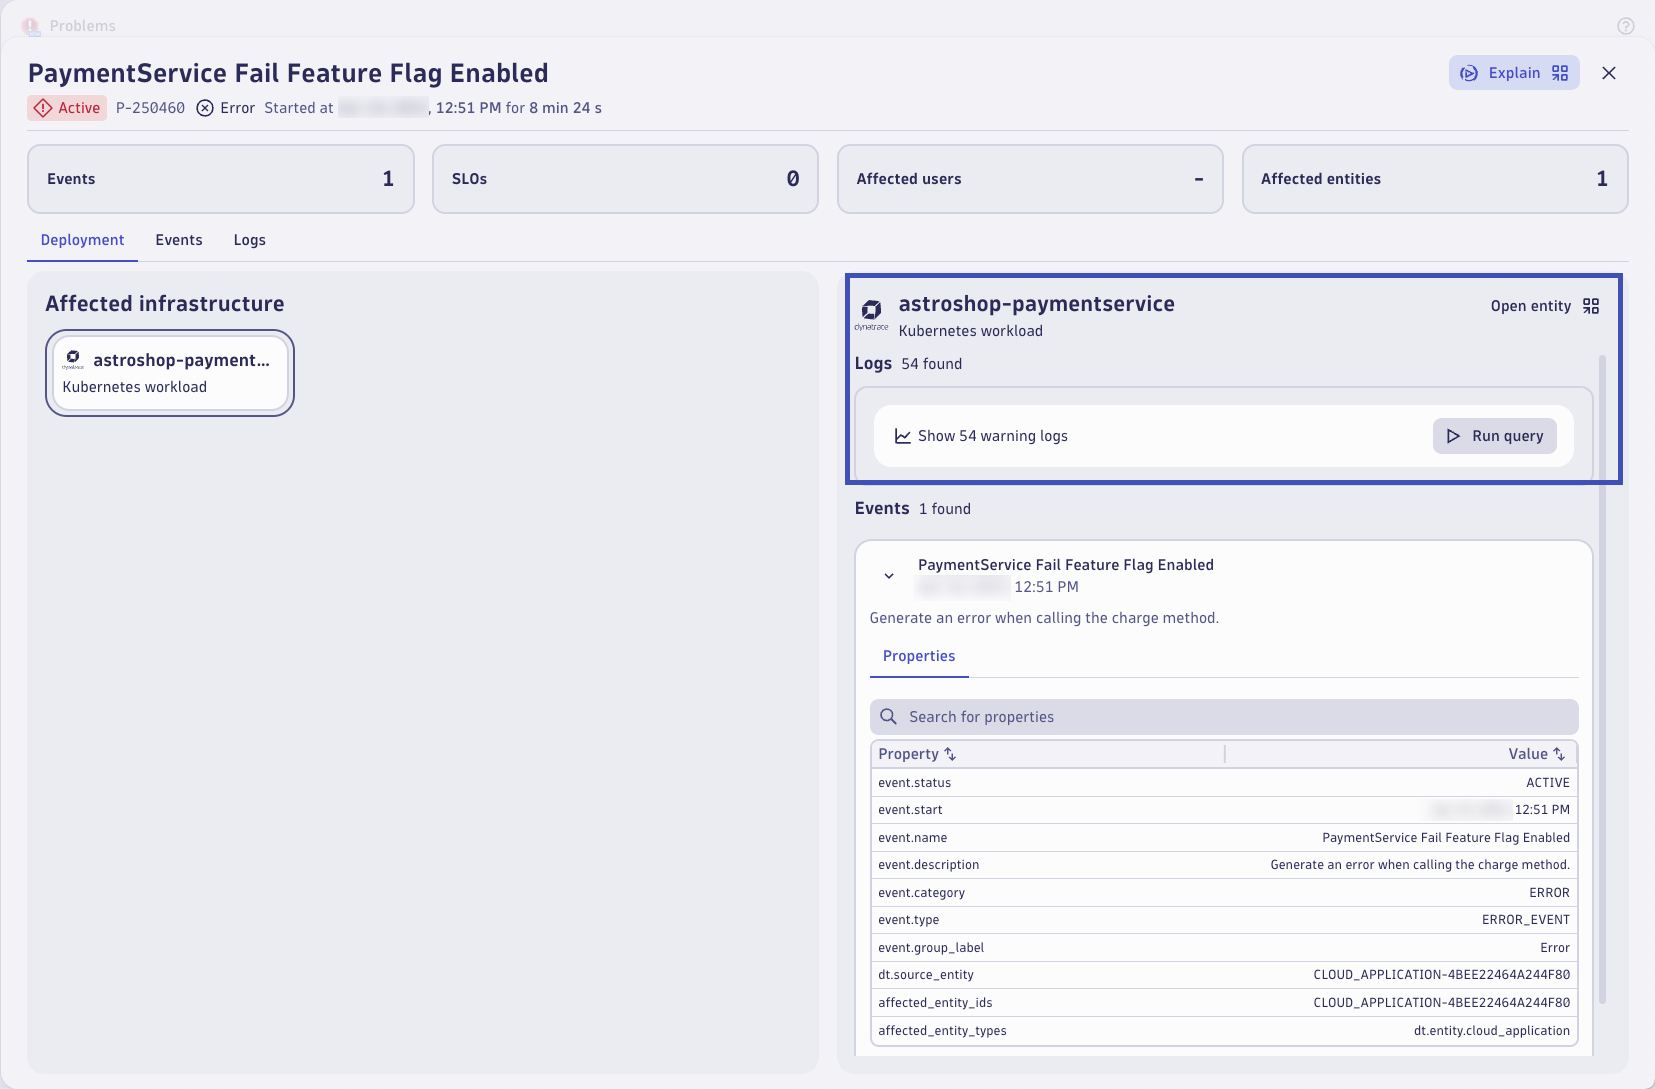
Relevant logs are shown in the logs tab. These are based on the impacted entity using a pre-built DQL query. Without any manual intervention or context switching, Dynatrace surfaces the root cause relevant logs. Just click on Run query
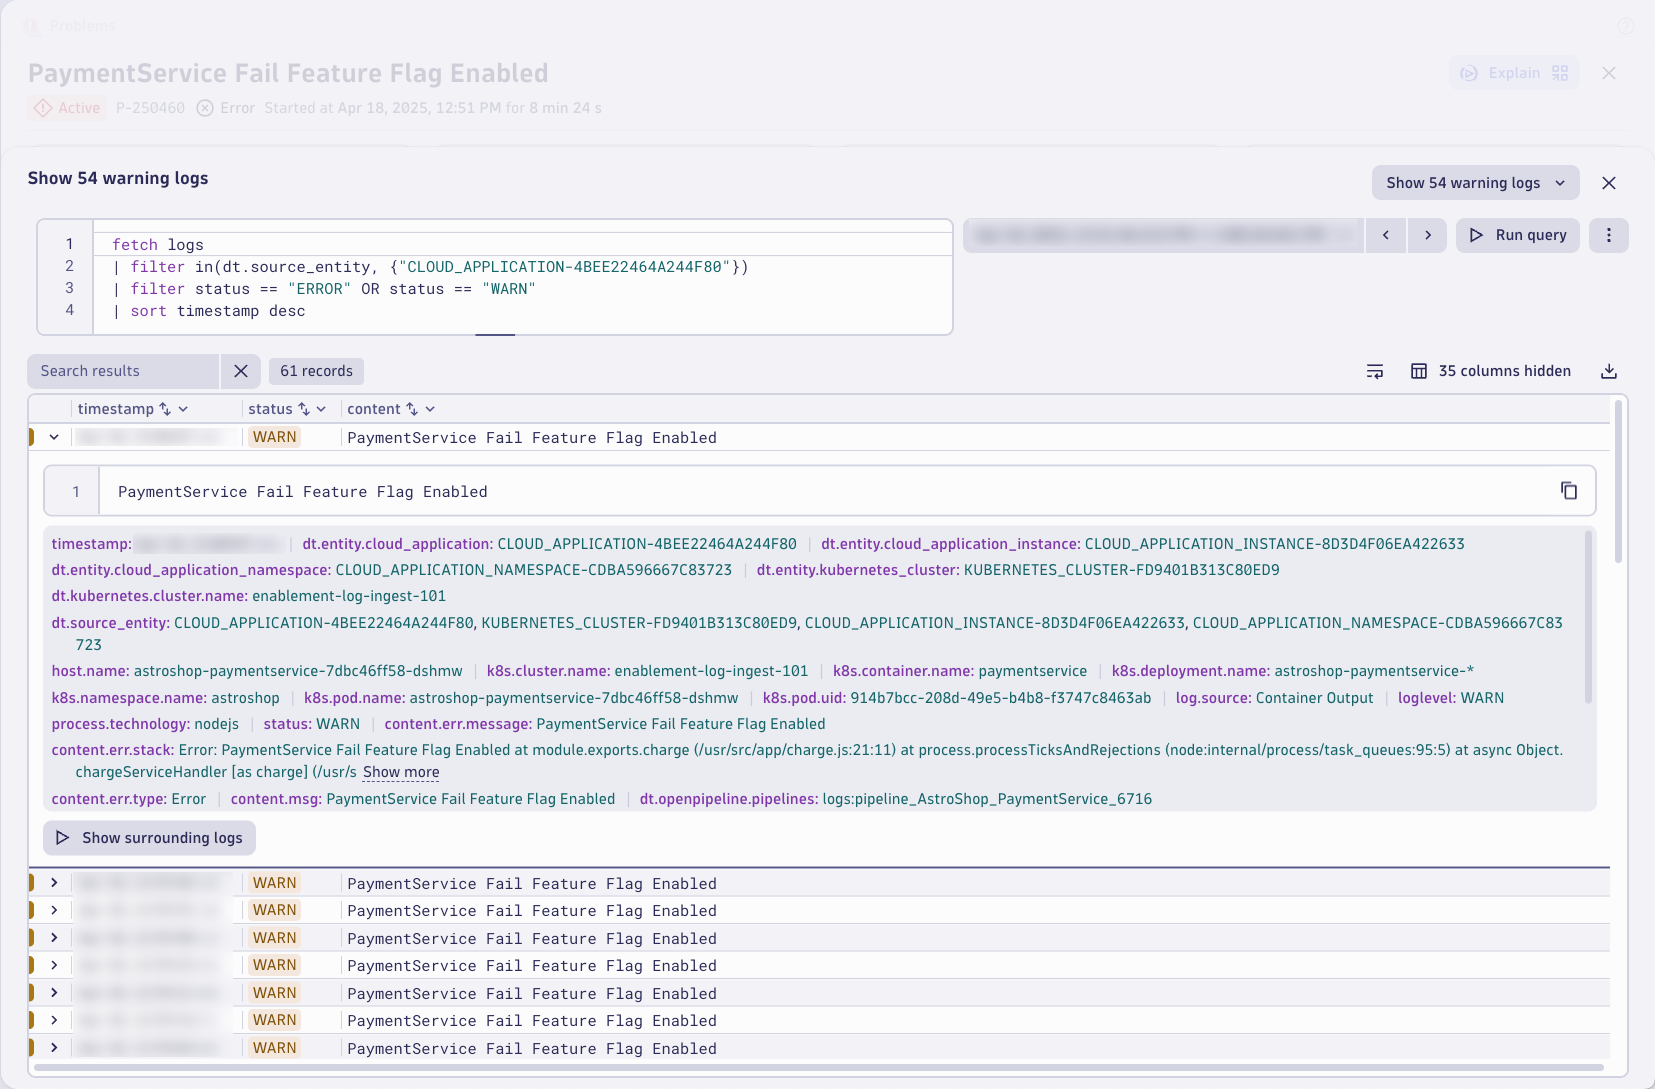
The logs have the error message and even the exception stacktrace information the developers would need to debug the issue.
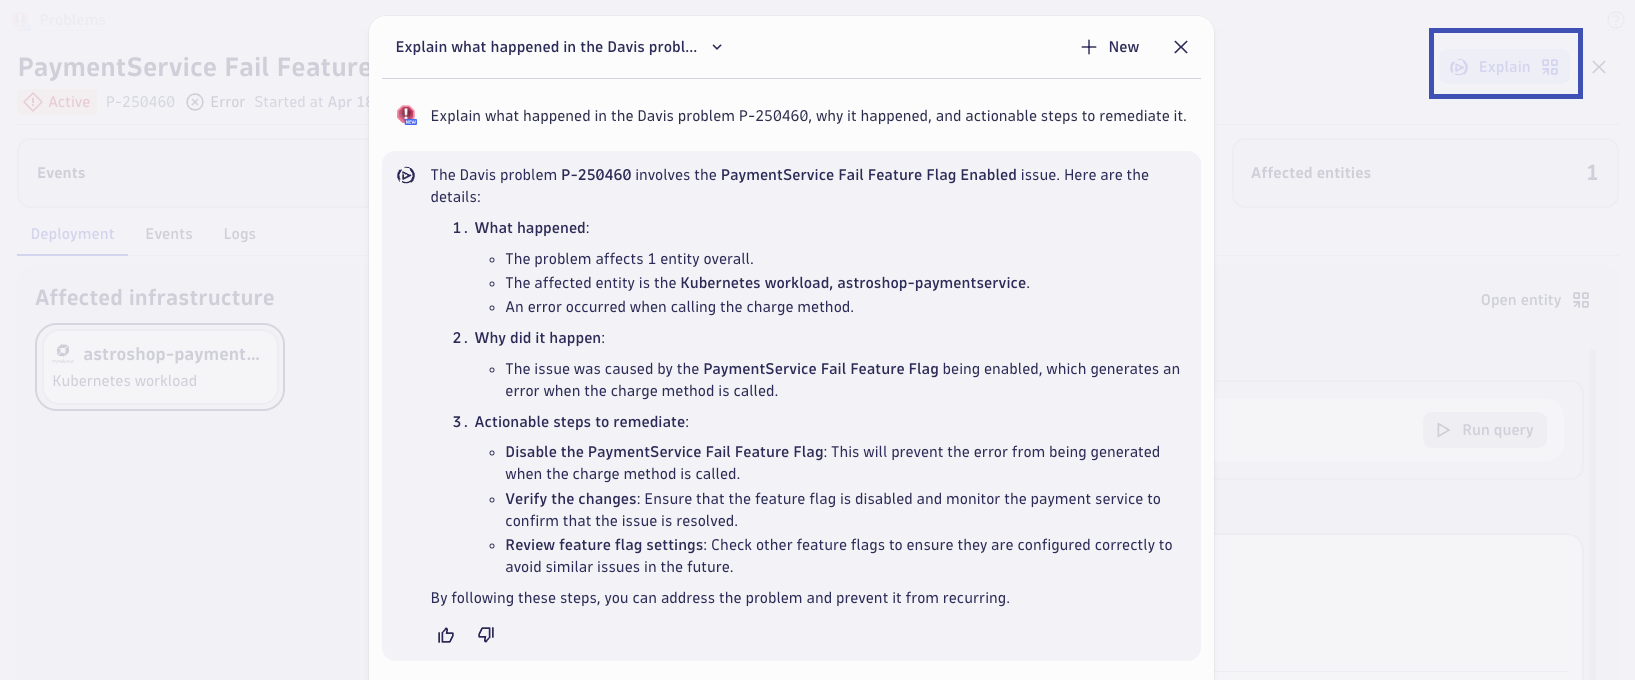
Dynatrace Intelligence Problem Explanation
Dynatrace Intelligent provides clear summaries of problems, their root causes, and the suggested remediation steps. Dynatrace Intelligence explains individual issues in clear language from the problem details page and can perform a comparative analysis when multiple problems are selected from the list view. This helps you identify common root causes and propose corrective steps without relying on a team of experts and waiting for hours for critical insights.
If your Dynatrace tenant has Dynatrace Intelligence capabilities enabled (optional, not part of this lab) then you should see a button that says Explain. Click it to open a prompt that will automatically ask Davis CoPilot to explain the problem in natural language and suggest remediation steps!
How to enable Dynatrace Intelligence
If if the explain button is not showing in the problem then you can follow the official documentation to get started enabling Dynatrace Intelligence generative AI on your environment
Kubernetes Context#
Next, let's approach this issue in the context of our Kubernetes environment. Dynatrace understands that the impacted entity is running on Kubernetes. You can access it directly from the opened problem and click on the View Kubernetes Workload.
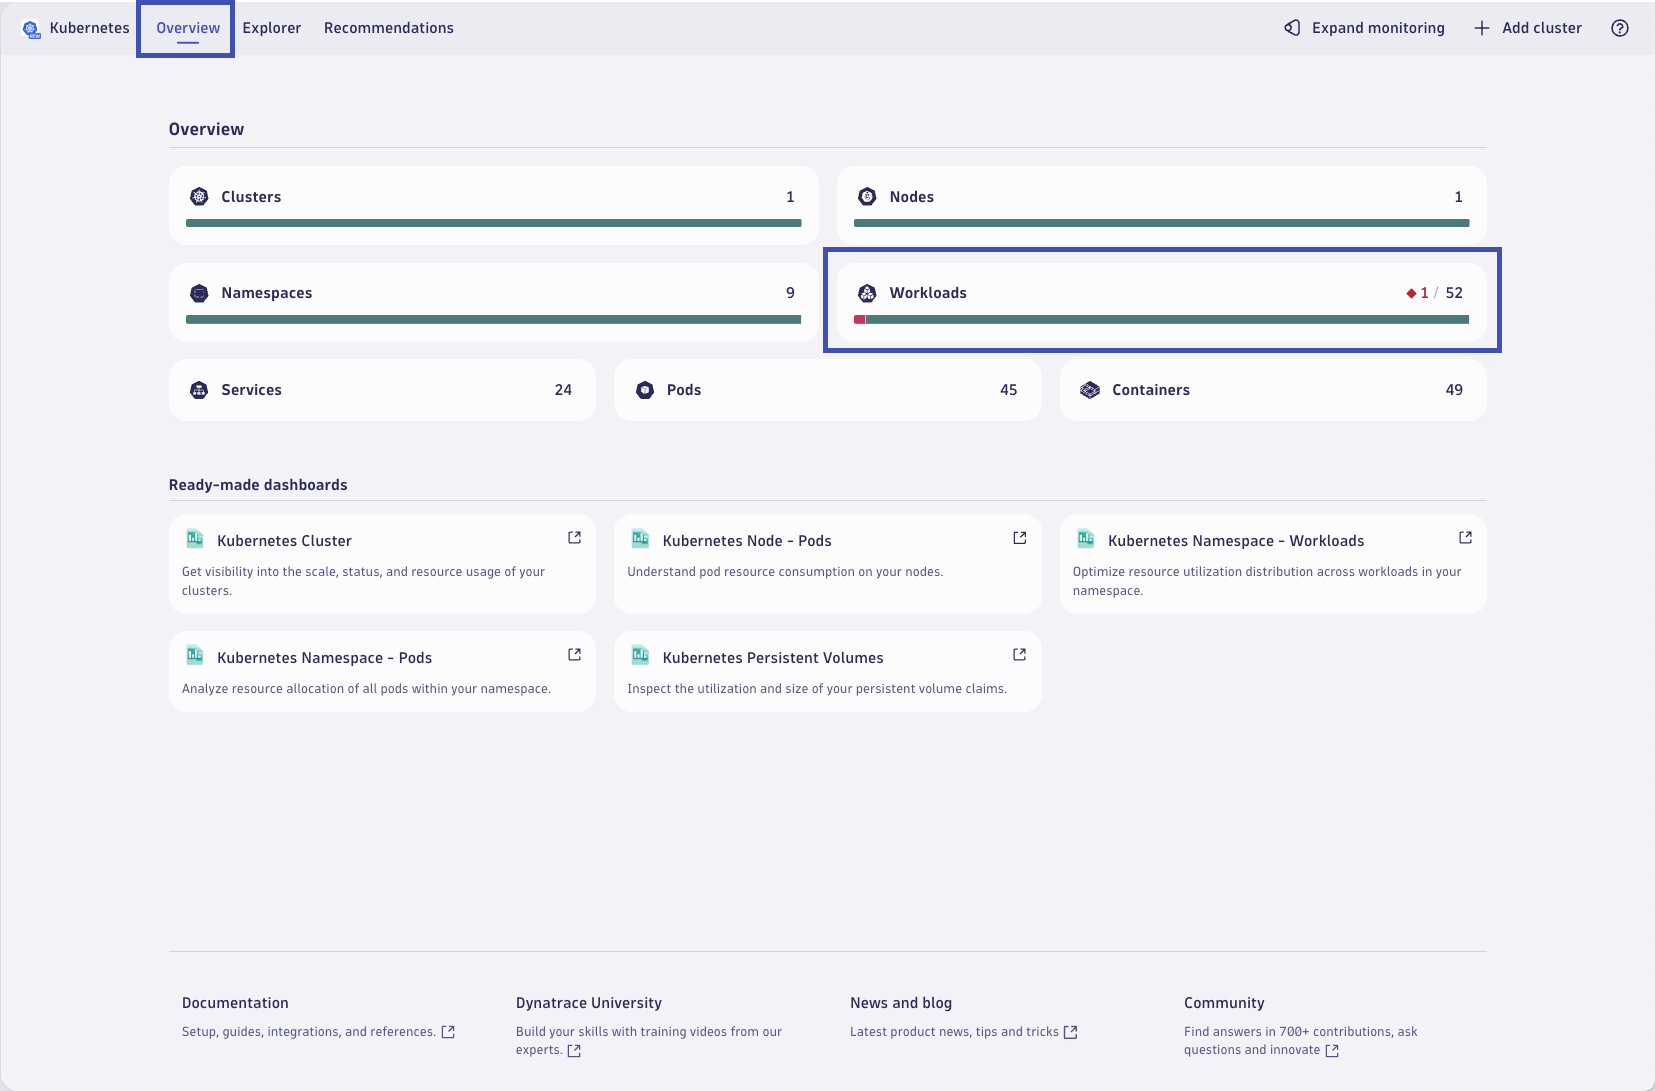
This will open the Kubernetes workload within the Kubernetes App within the problem context! This allows you to navigate through the apps (not only Kubernetes) in the problem timeframe, making it easy to spot anything related to the problem.
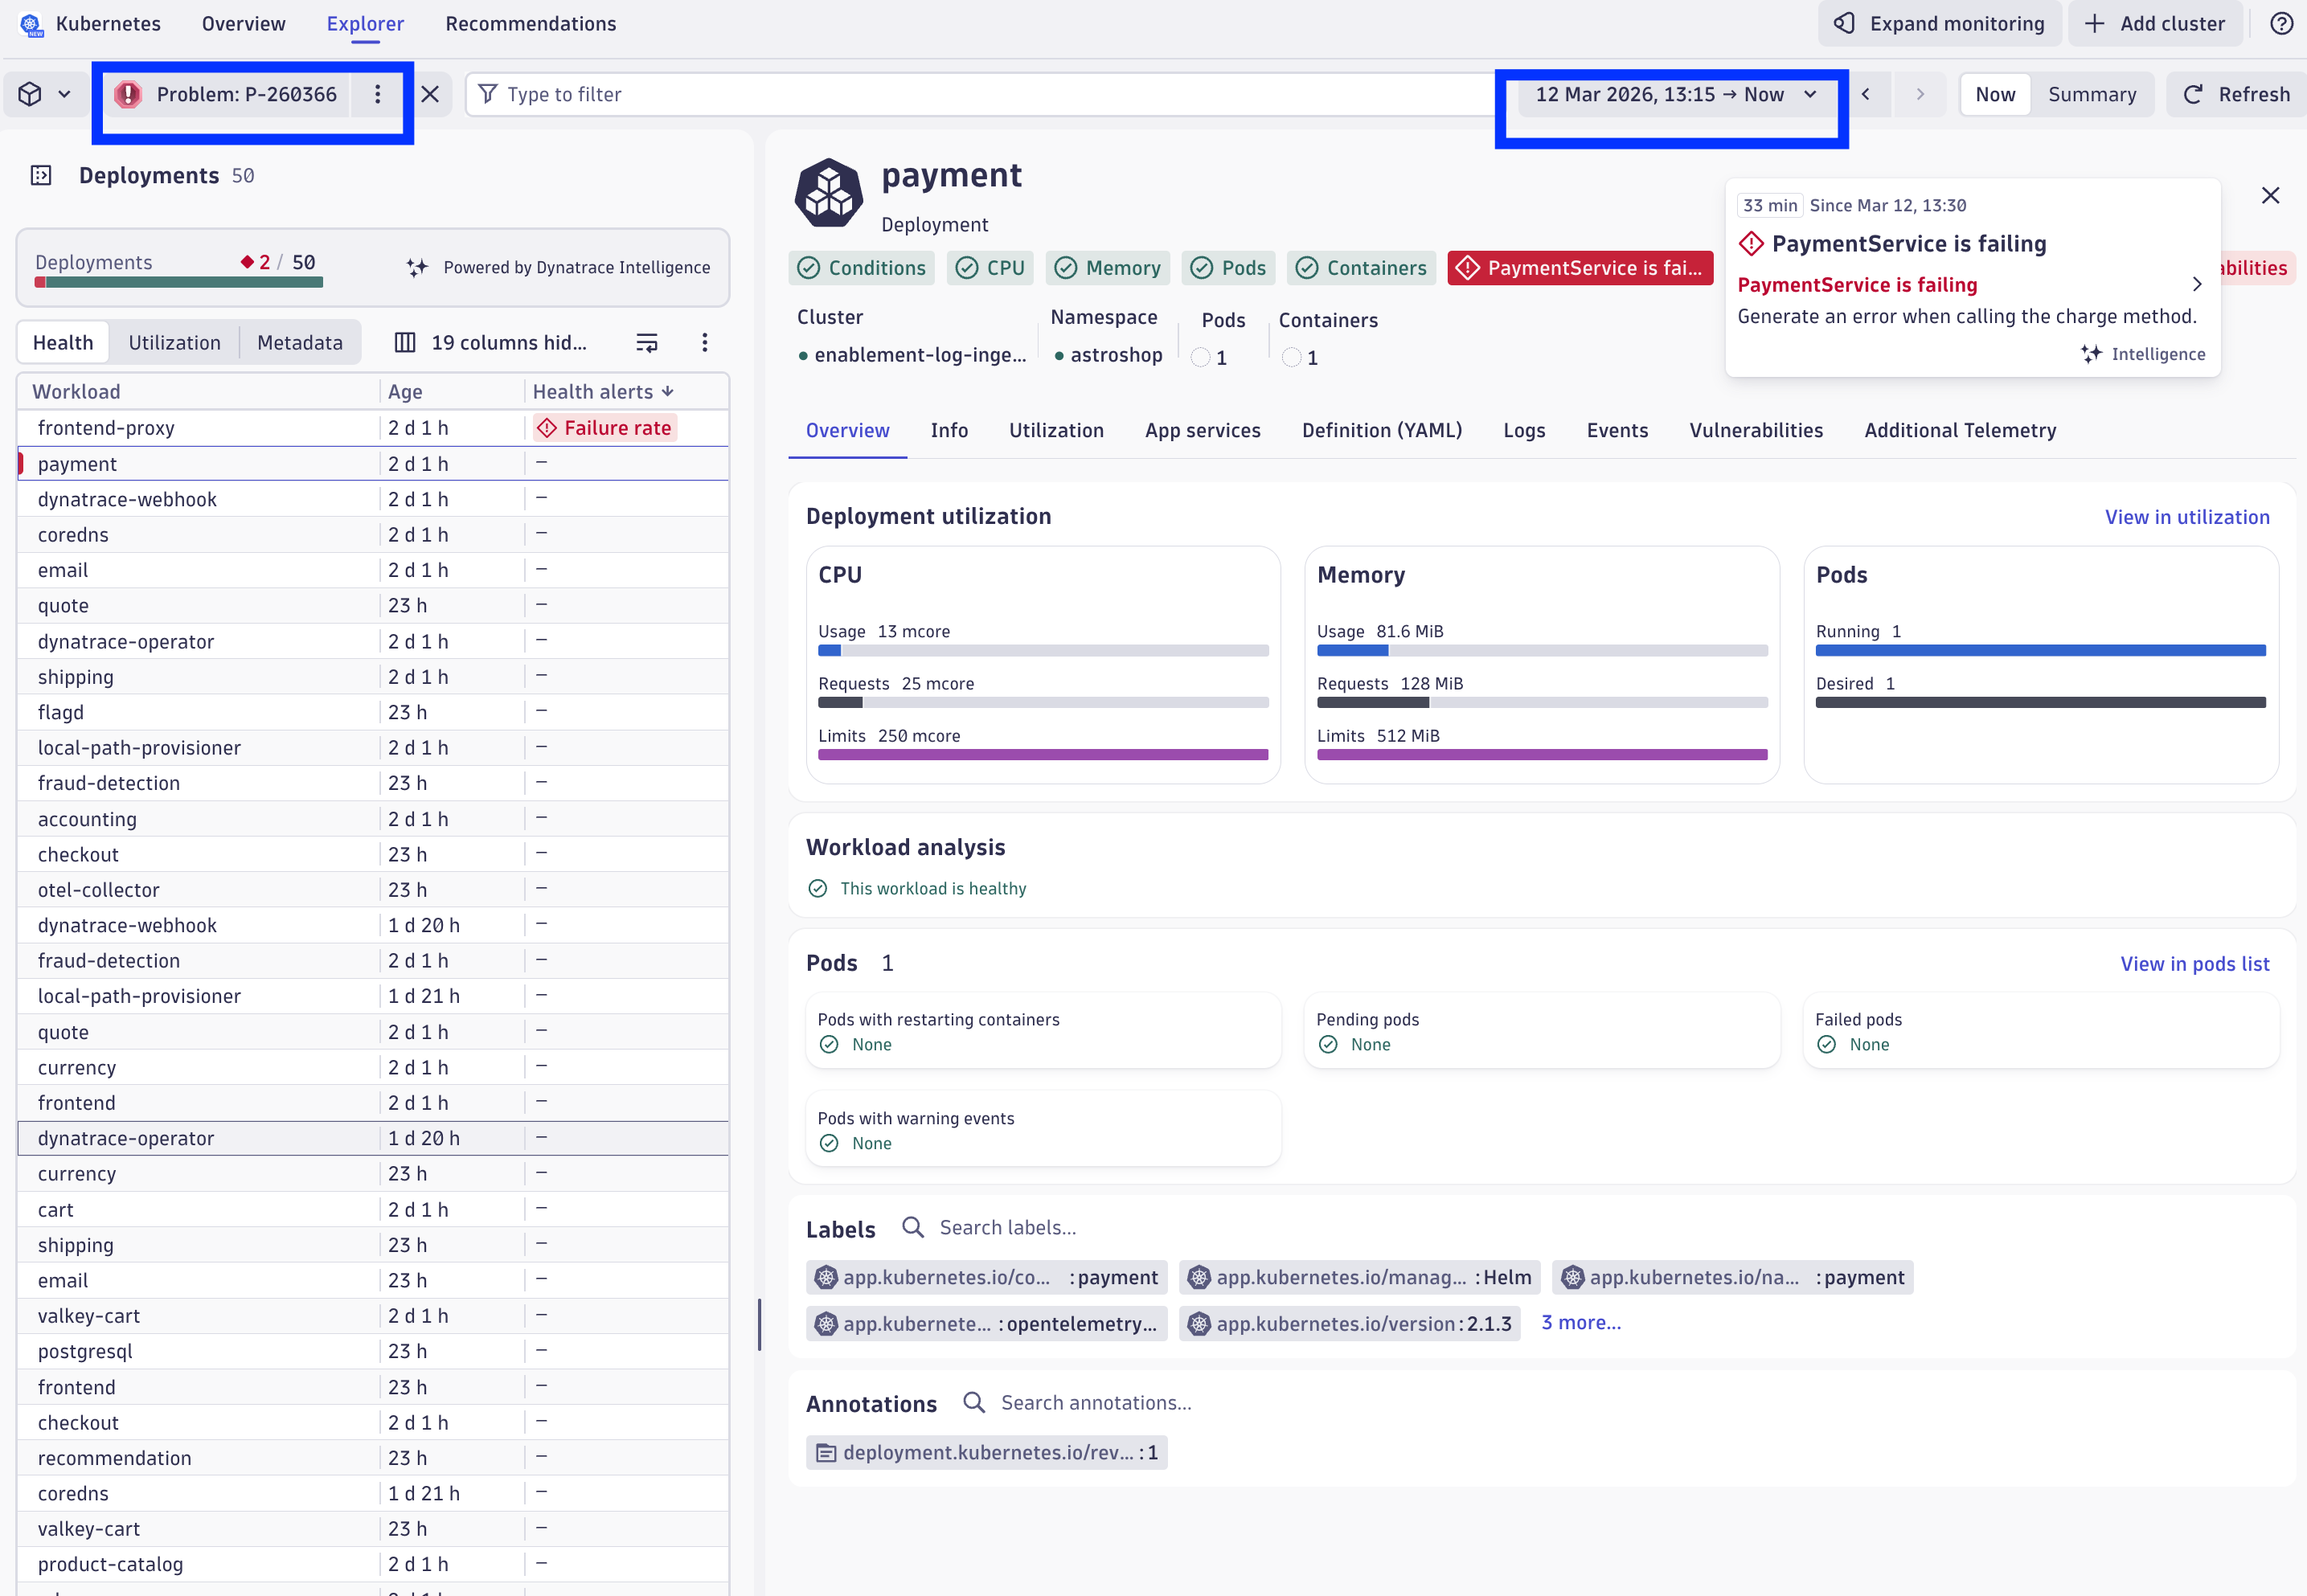
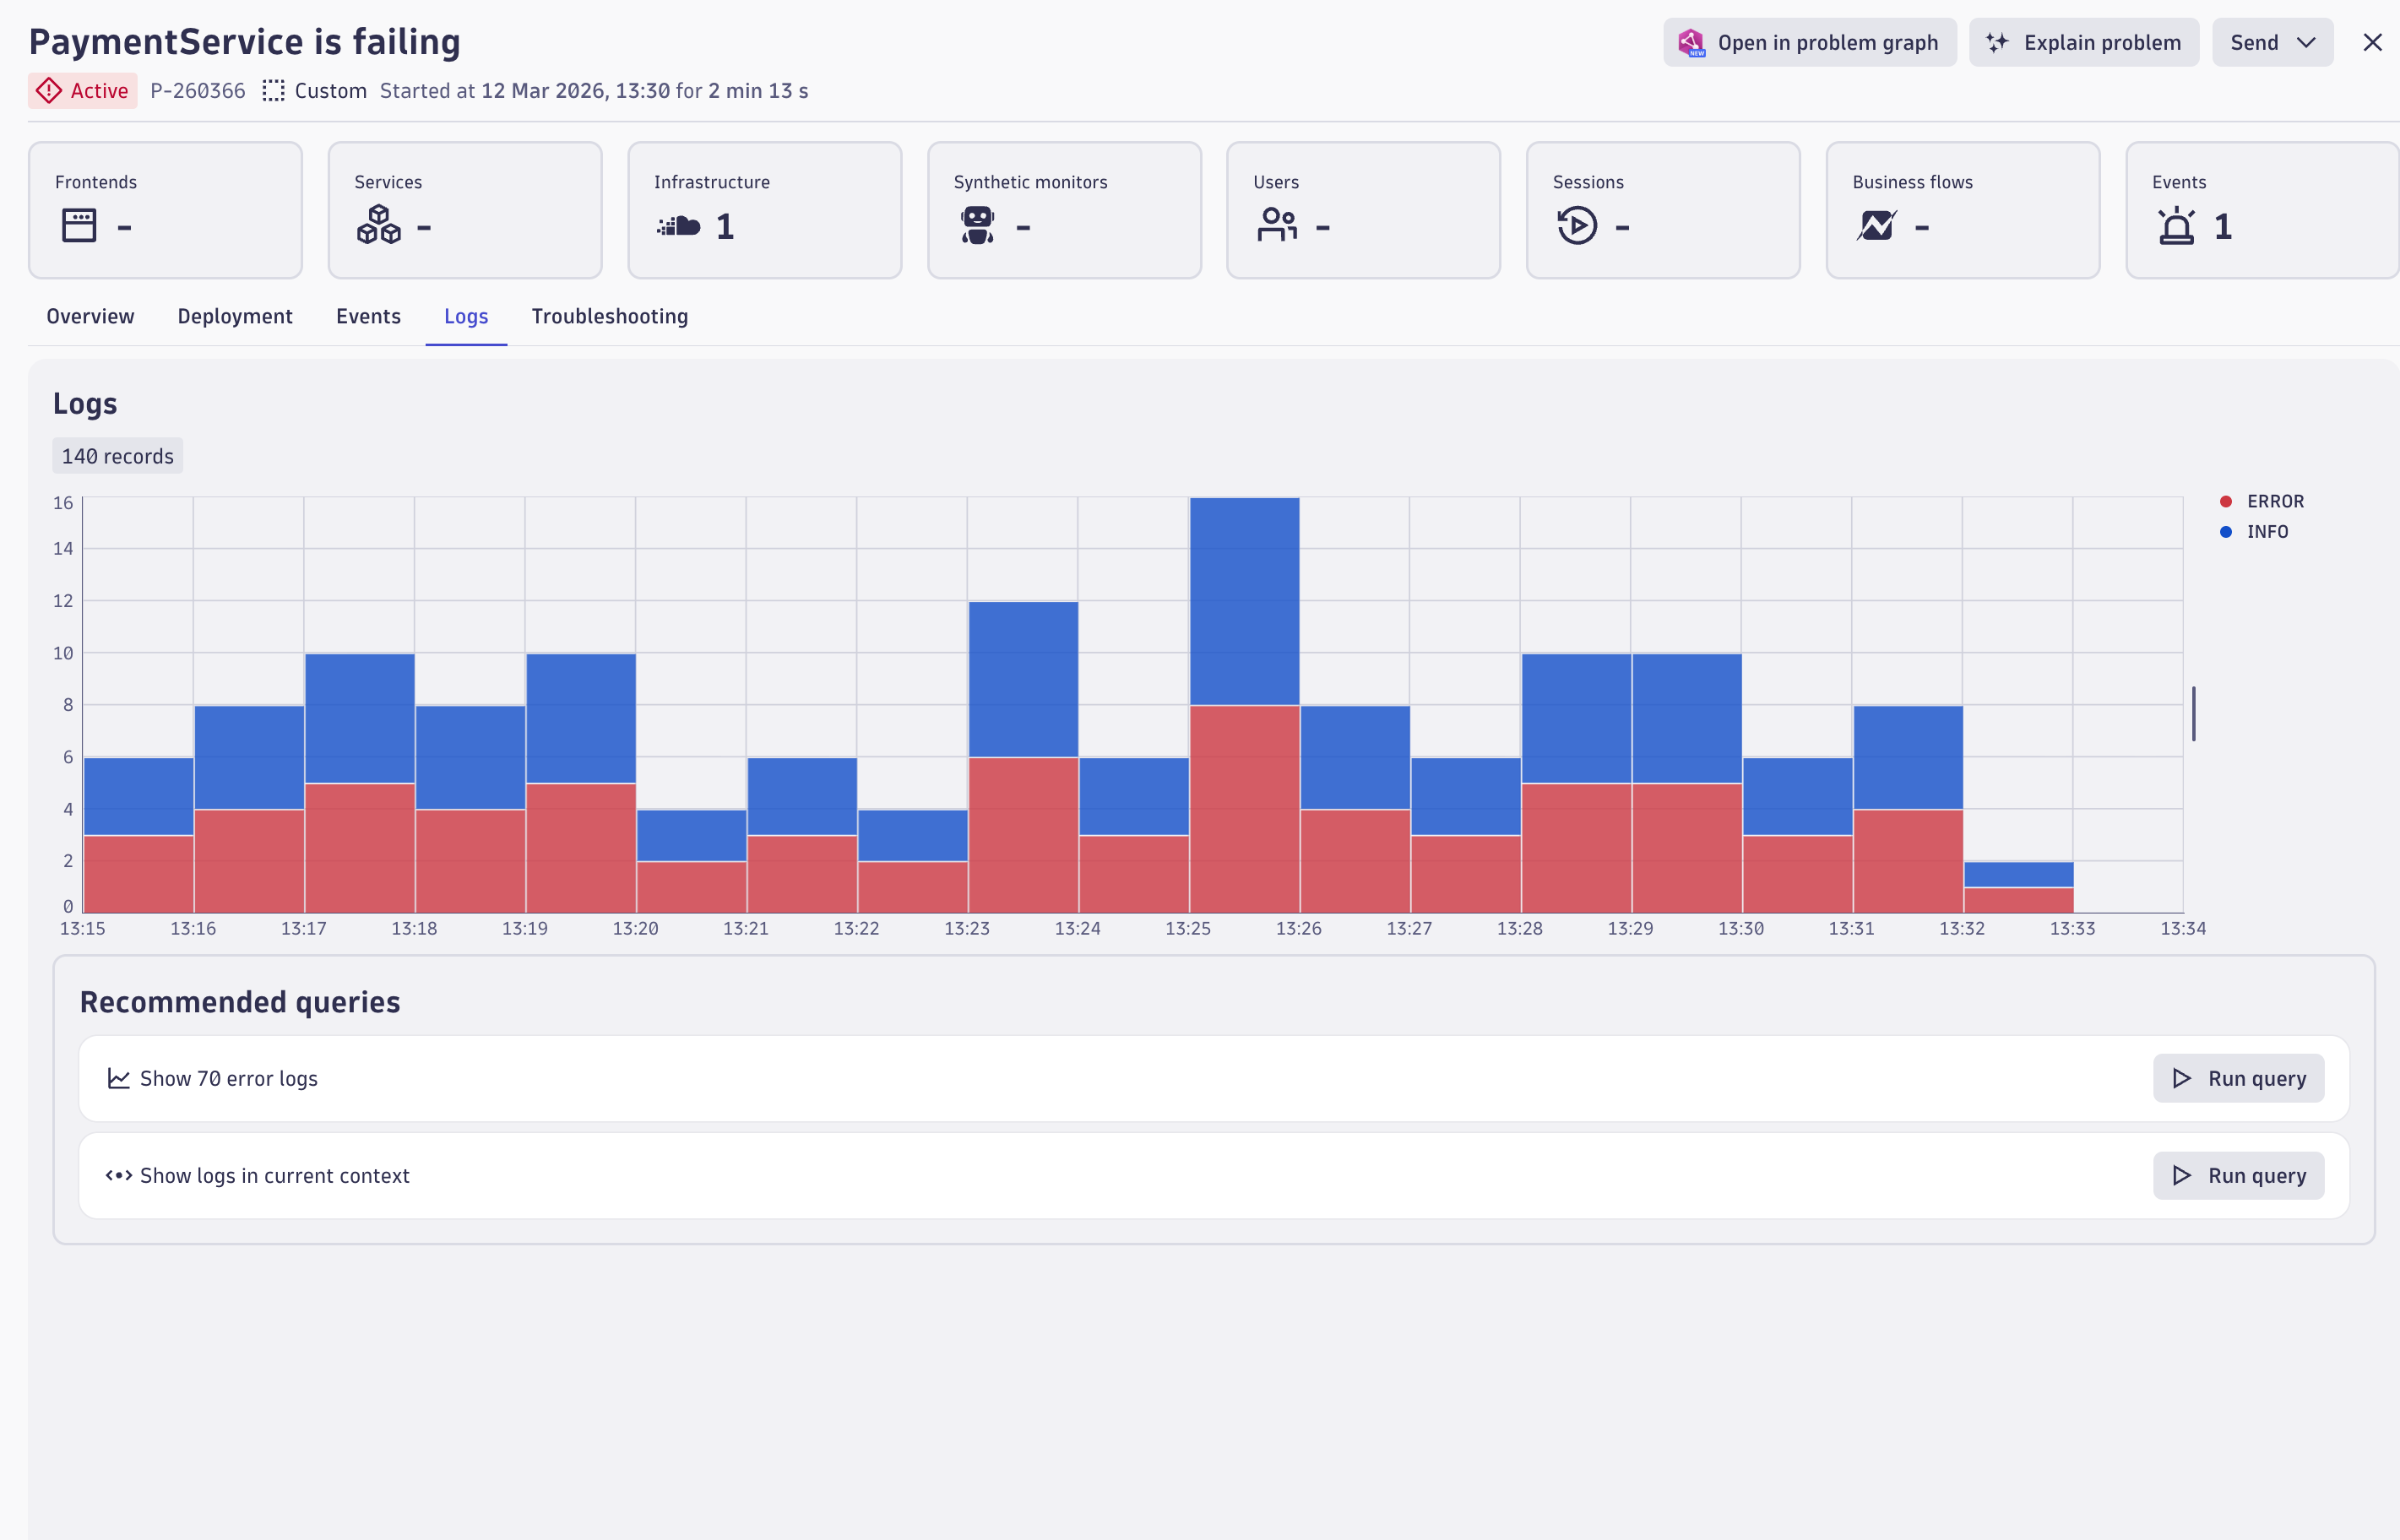
In the payment workload, we can immediate identify that there aren't issues with the workload related to Kubernetes workload conditions, CPU or memory resource usage, running/ready pods, or with the container health. They are all green, except the custom error shown as "Payment Service is failing".
Let's explore the logs for this workload in the context of the Kubernetes entity. Click on the Logs tab.
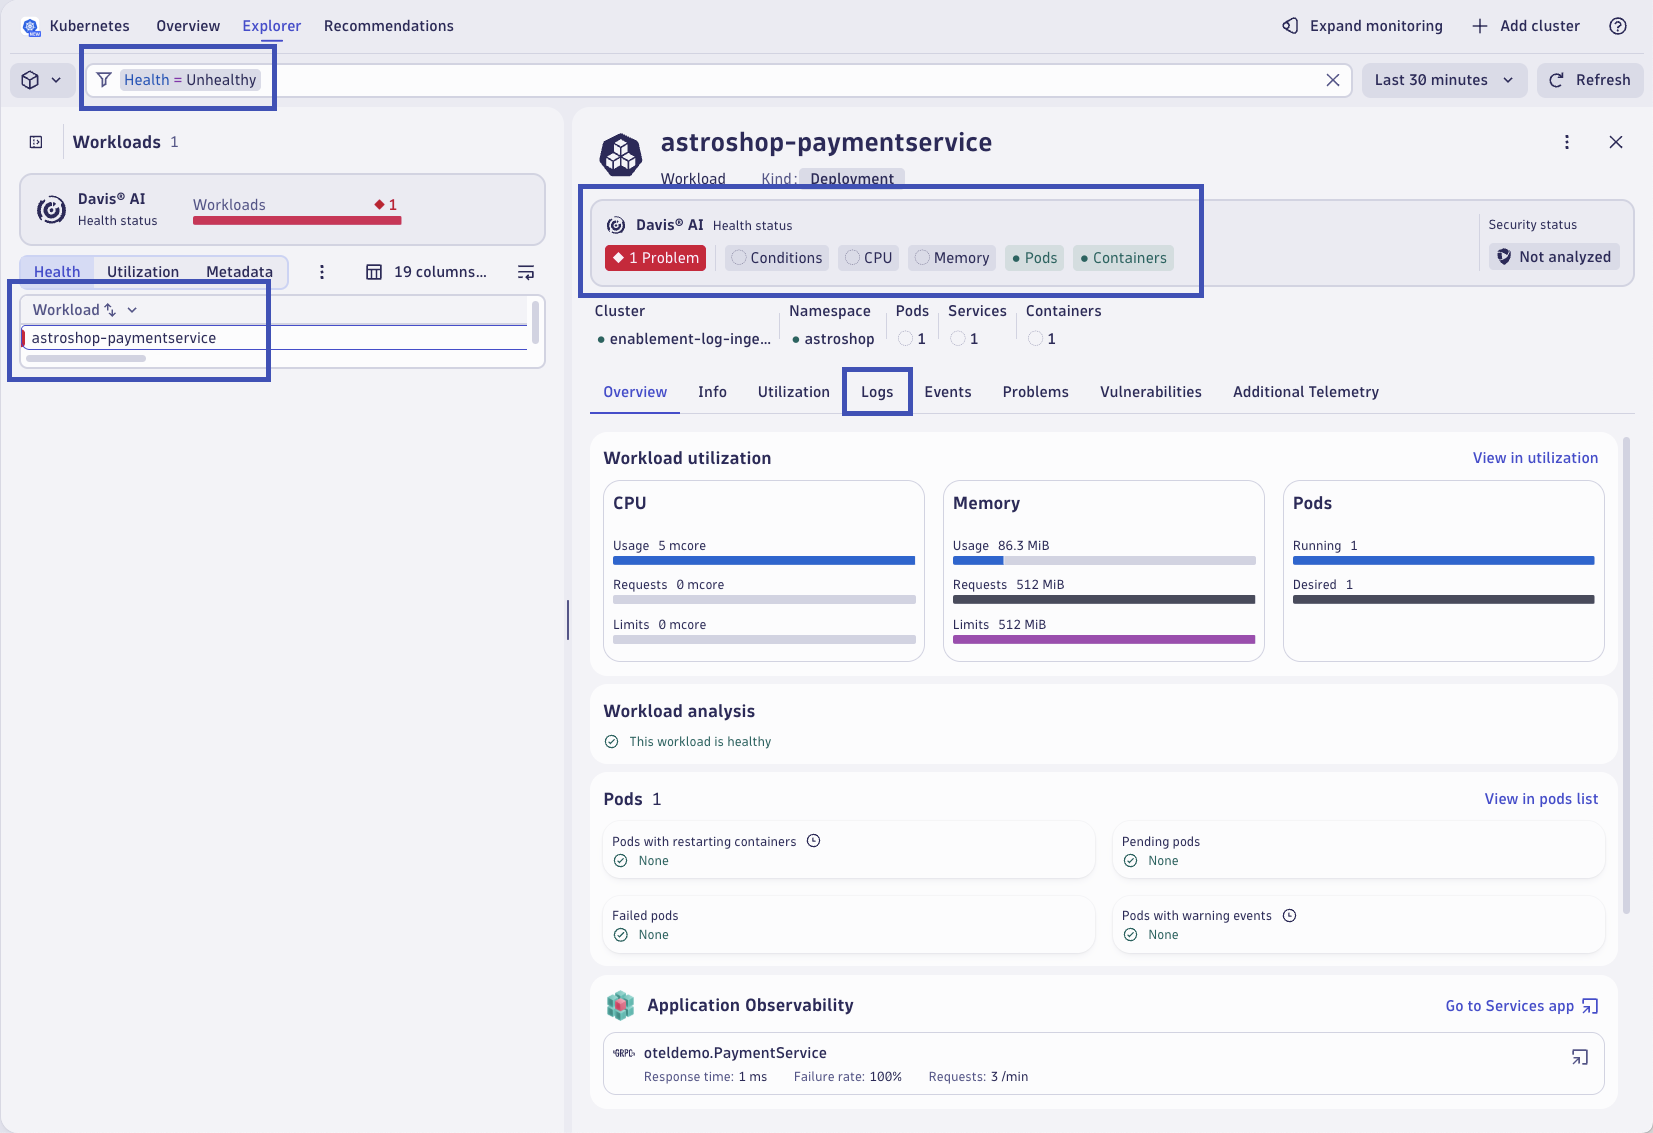
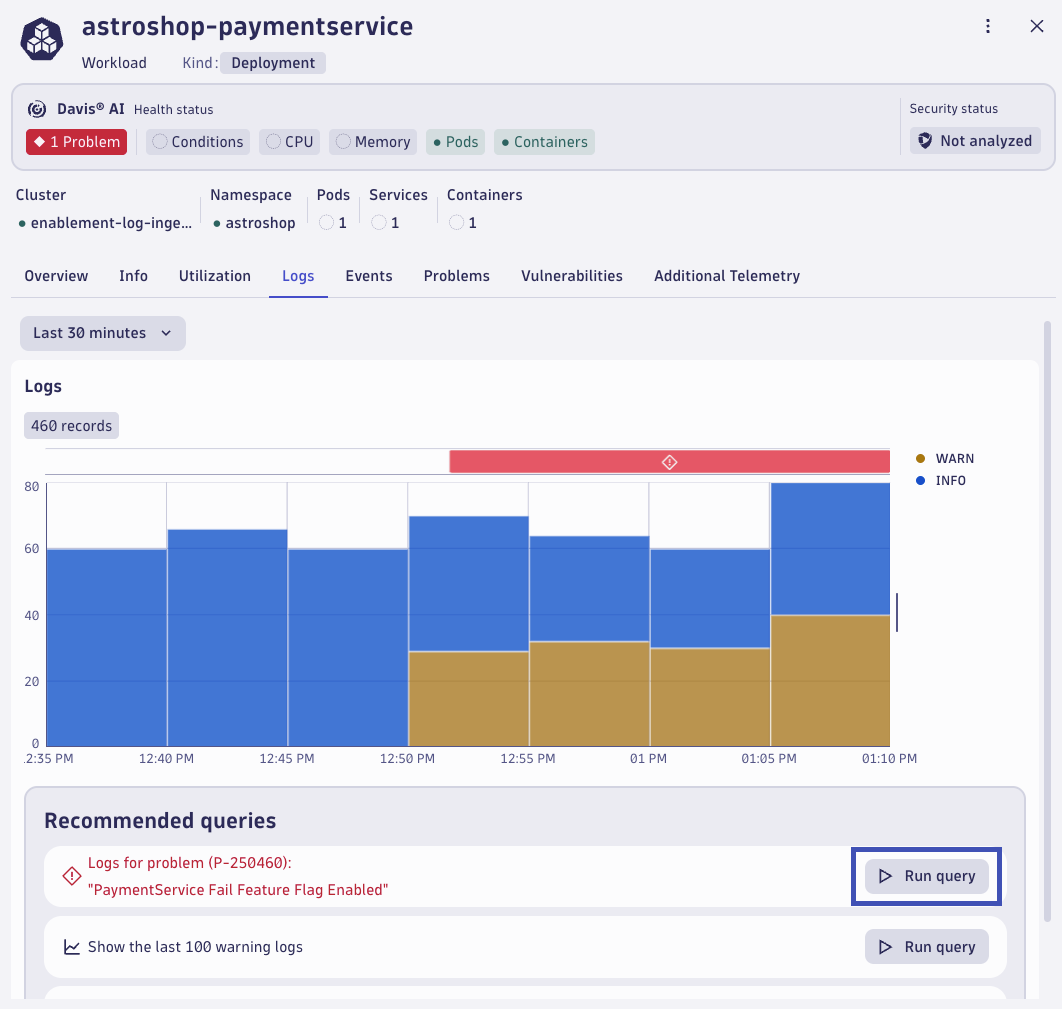
Dynatrace highlights that there are logs relevant to the root cause of the problem for this workload. Additionally, the Dynatrace Intelligence recommends a query that can be executed to view these relevant log records. Click on Run query.
Relevant logs are queried based on the impacted Kubernetes entity using a pre-built DQL query. Without any manual intervention or context switching, Dynatrace surfaces the root cause relevant logs. The logs have the error message and even the exception stacktrace information the developers would need to debug the issue.
Connecting log data to traces
Dynatrace can enrich your ingested log data with additional information that helps Dynatrace to recognize, correlate, and evaluate the data. Log enrichment enables you to seamlessly switch context and analyze individual spans, transactions, or entire workloads + empower development teams by making it easier and faster for them to detect and pinpoint problems.
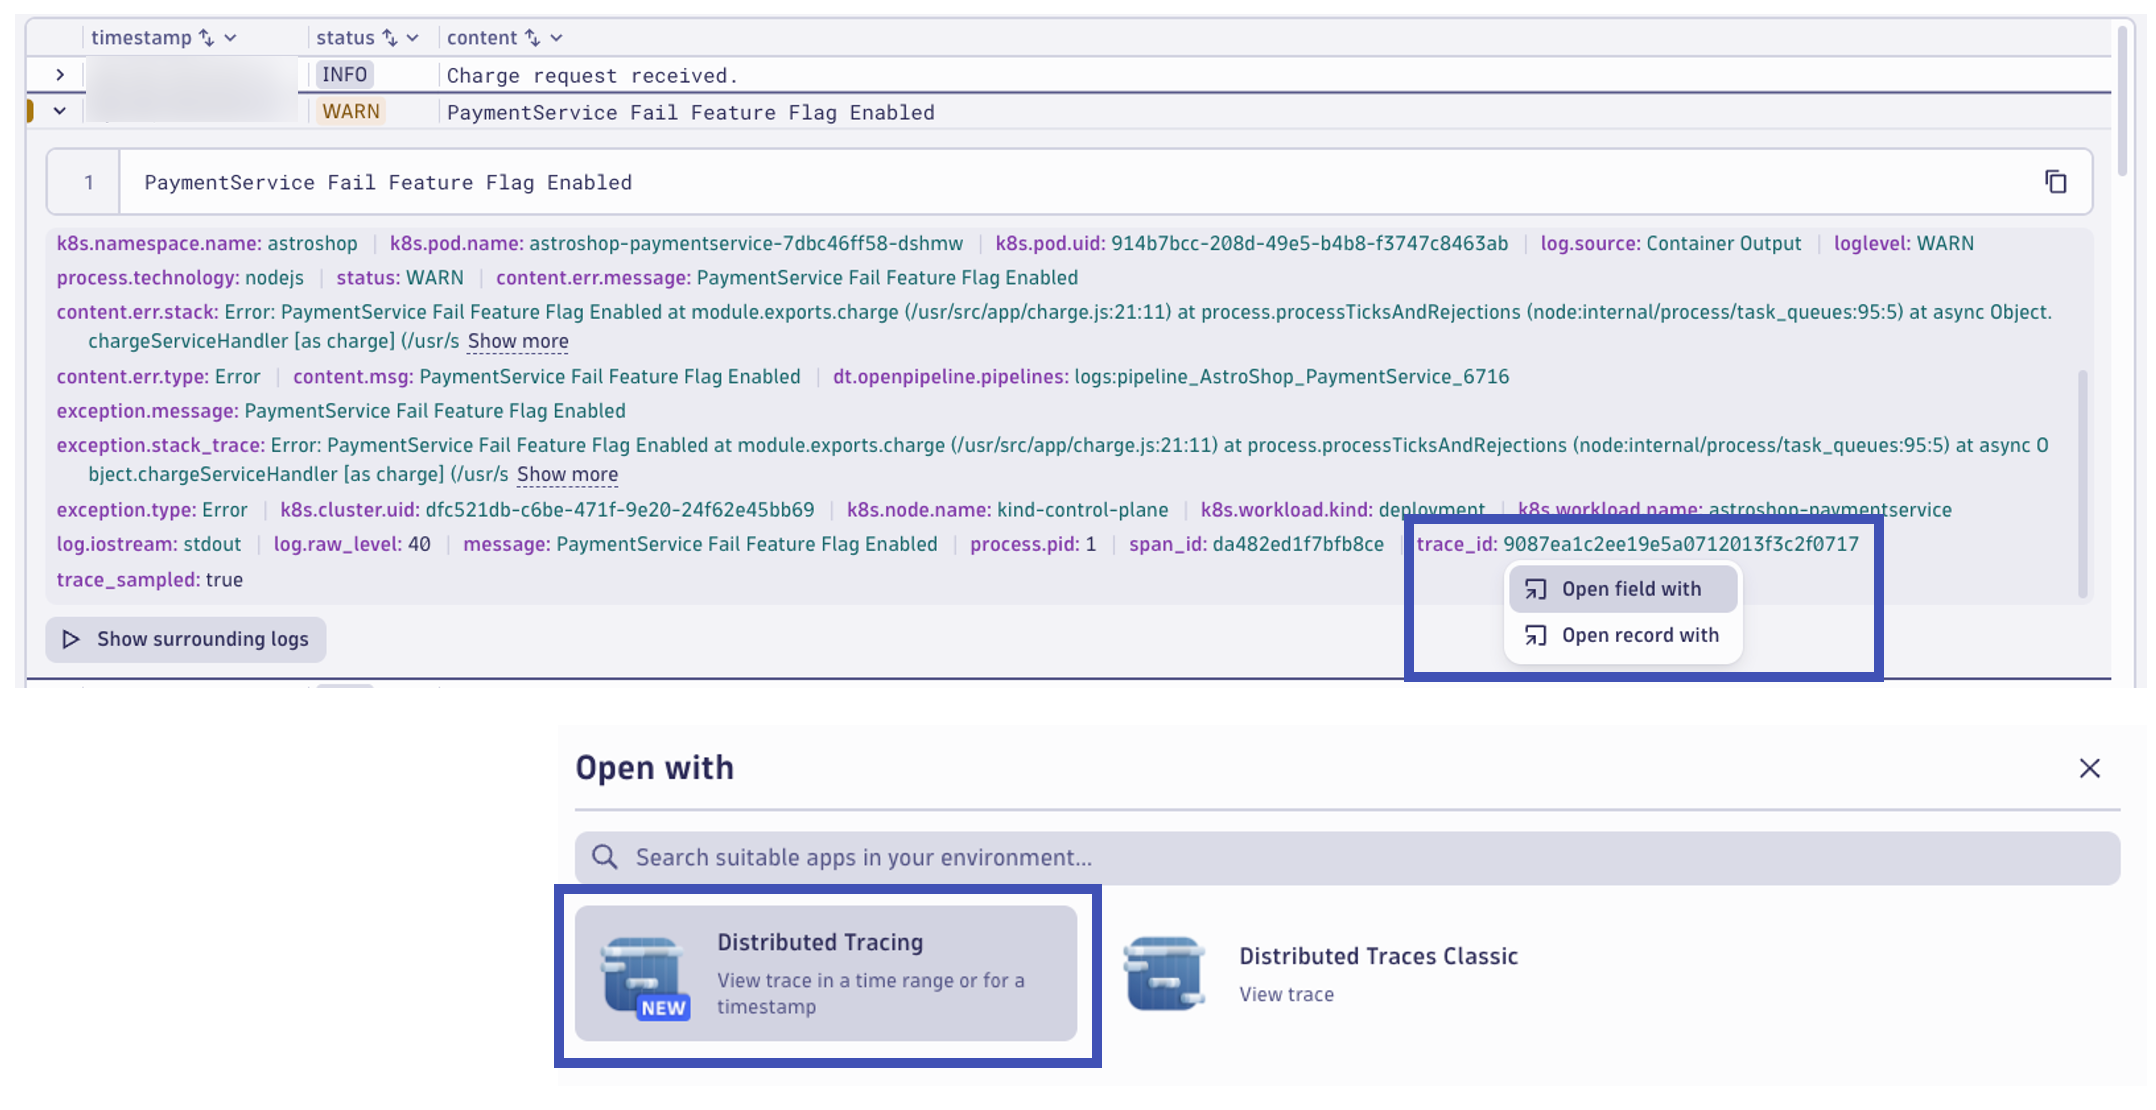
From here, we can view the correlated distributed trace for the transaction that wrote this log record. In the log record, at the right in the ... (3 dots) click on View trace.
Distributed Tracing and Services Apps#
A distributed trace is a collection of spans representing a request's journey through a distributed system.
The request is the call initiated by a user or system to perform a specific task. It interacts with various services and components within the distributed system. Spans are individual operations representing each request interaction with the distributed system.
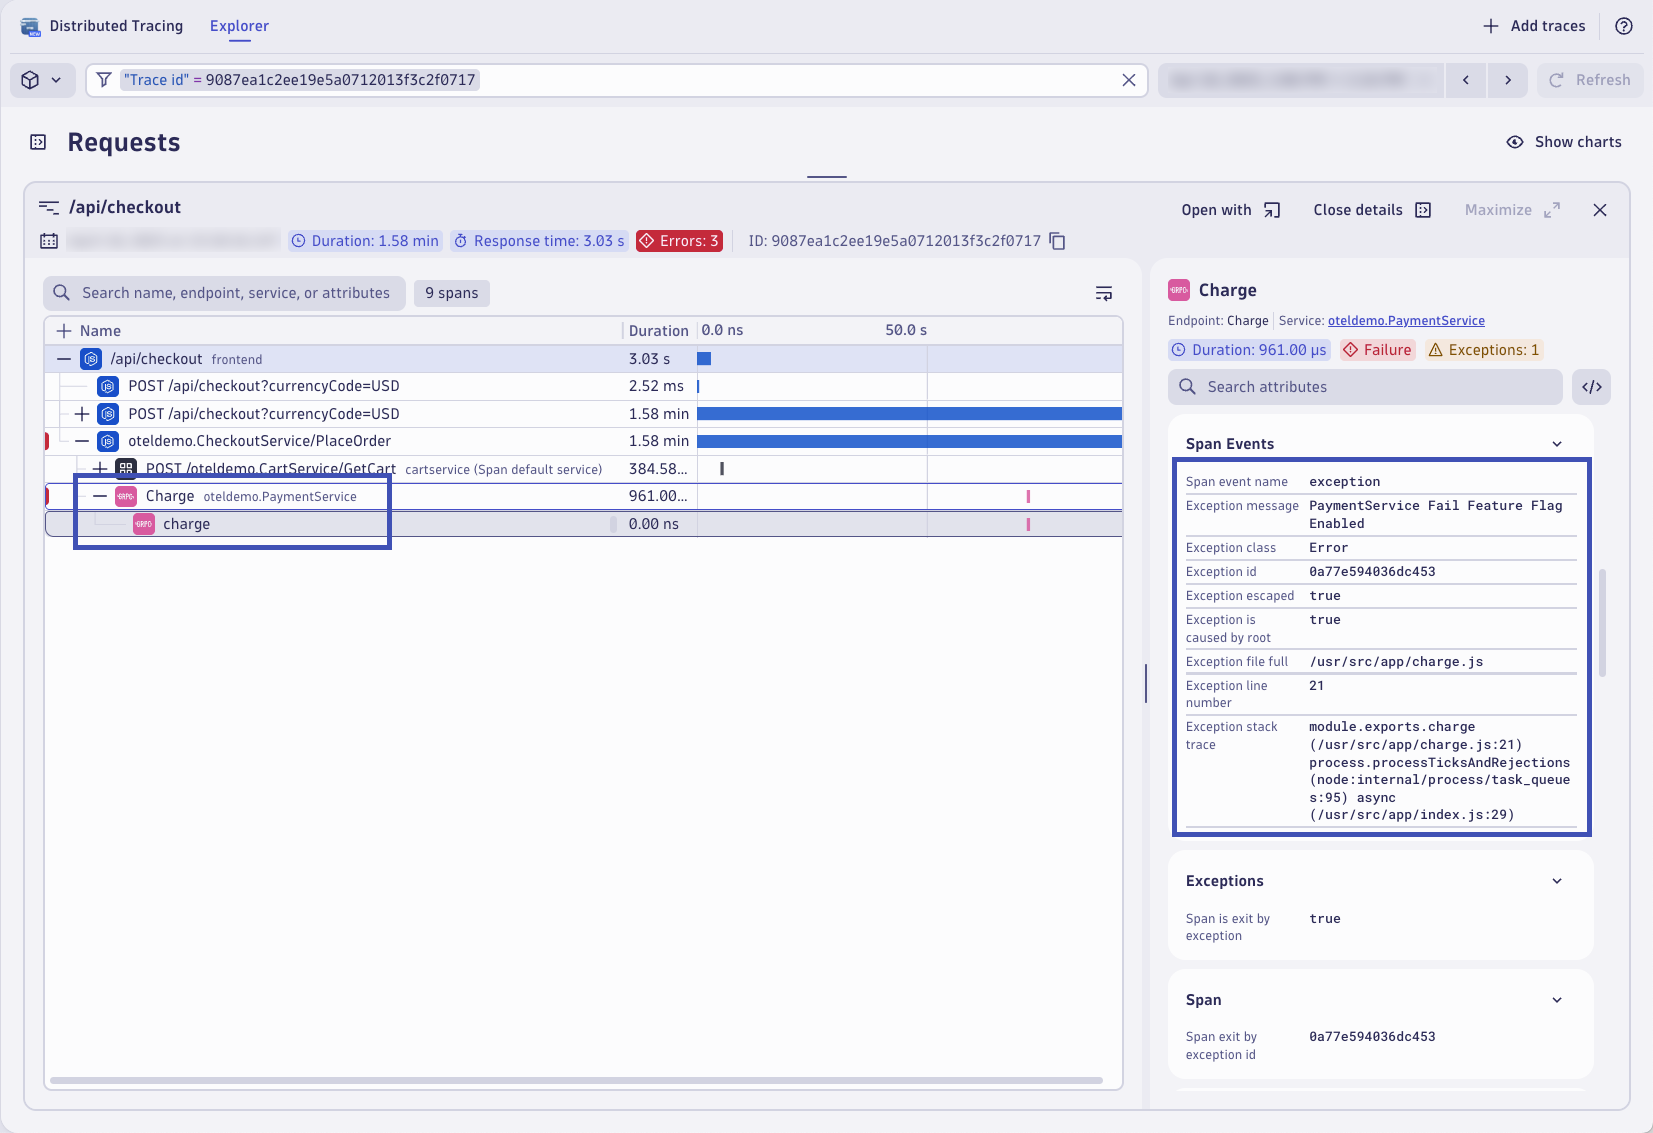
The Distributed Tracing app will open already filtered to view the trace from the log record based on the trace_id. From the trace waterfall view, expand and locate the charge span from the PaymentService. The span includes response time information, but it also includes a lot of valuable span attributes and attached span events. In the Span Events section, locate the Exception details. Here you can see where the transaction encountered the exception that caused the transaction to fail.
Dynatrace automatically aggregates trace data into a service entity. Traces, and ultimately spans, are analyzed out-of-the-box to measure the health of your endpoints and transactions across web, messaging, database, and other technologies. Dynatrace provides aggregated metrics by default for things like response time, throughput, failure rate, and resource usage. This allows you to easily find problems with your endpoints, identify hotspots, and analyze relevant trace data in real-time.
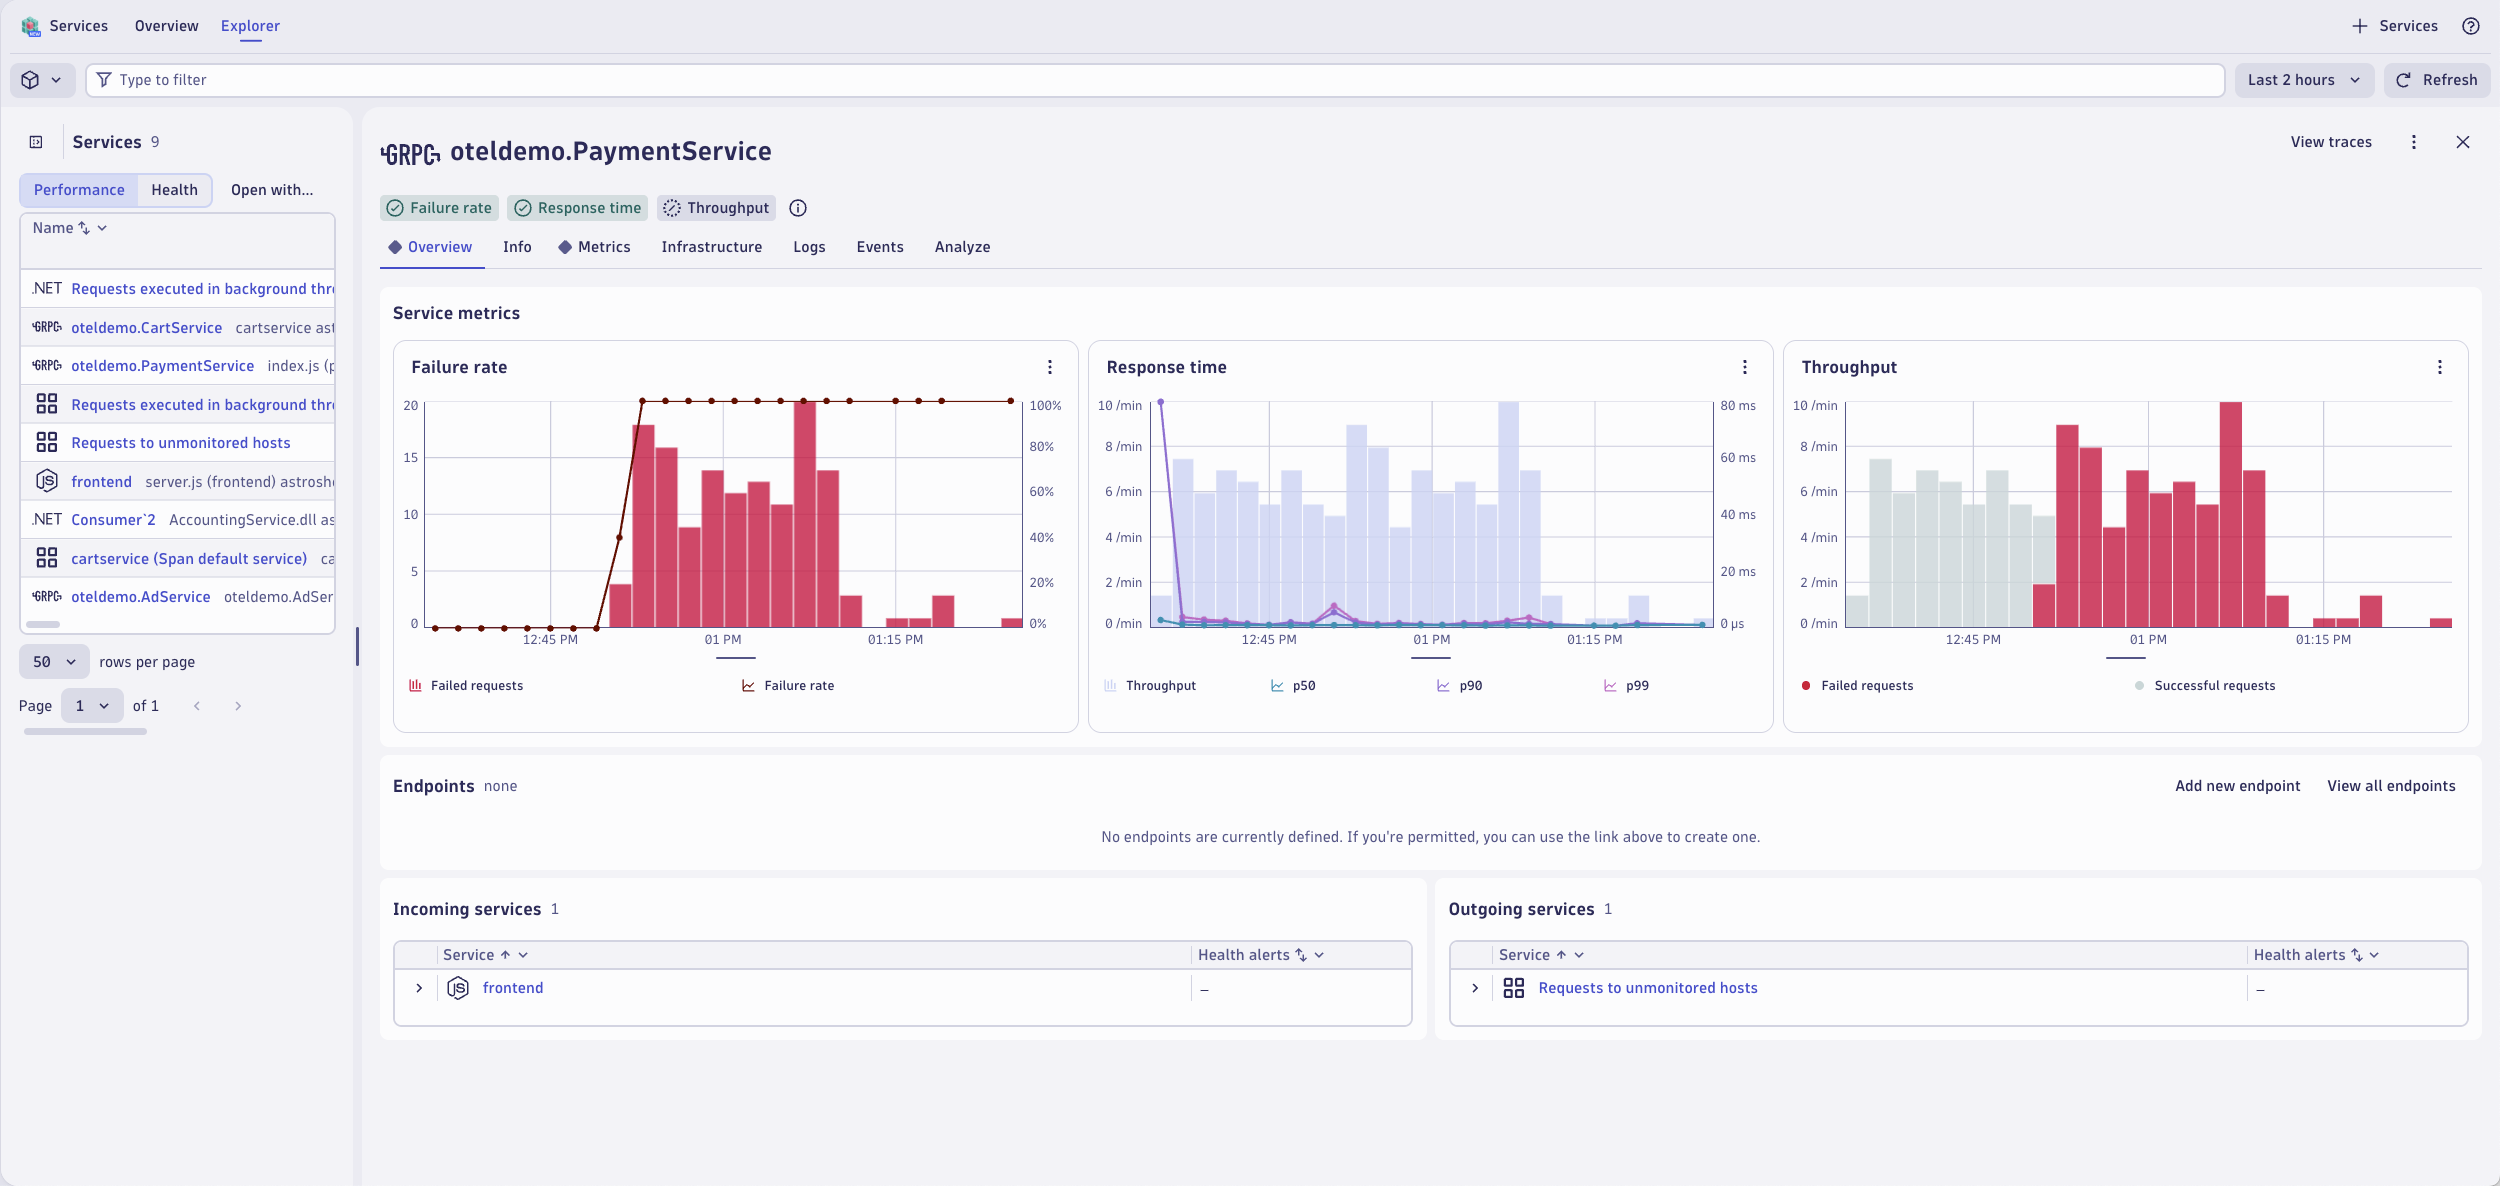
This span belongs to the PaymentService. Open the service in the Services app by click on oteldemo.PaymentService.
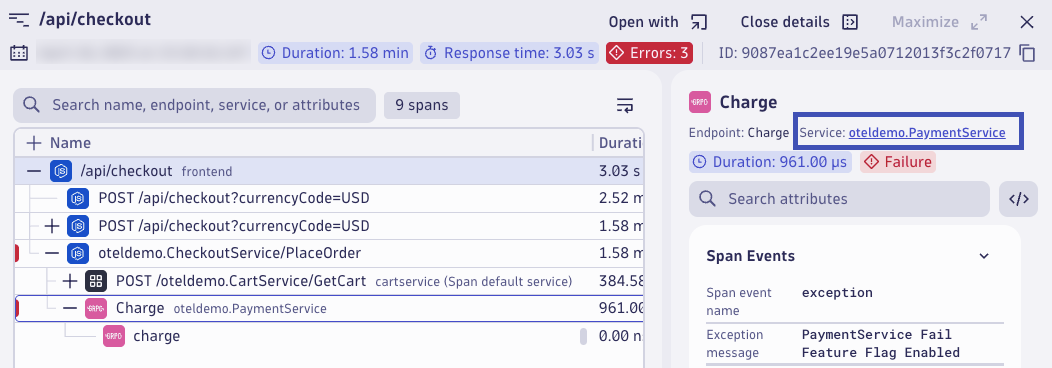
The Services app opens with the PaymentService selected. Here you can view the failure rate, response time, and throughput metrics for this service. From here, you can drill down into more distributed traces for this service, find any correlated log records, view infrastructure health including Kubernetes entity details, and understand the topology and dependencies of this service.
Having logs, together and in context with metrics and traces, is essential to having a unified observability strategy. Logs, metrics, and traces together is nice to have, but correlating them together and in context with application and infrastructure topology greatly speeds up troubleshooting. Logs in context allow you to make better real-time business decisions by understanding business outcomes correlated with underlying system health.
Knowledge check#
Complete the assessment below to validate what you learned in this lab.
Training complete!
You deployed the Dynatrace Log Module, configured log ingest rules, masked sensitive data, split multi-line records, shaped logs with OpenPipeline, and analyzed a failure end to end across Problems, Kubernetes, Traces, and Services. 🎉
Your hands-on environment is cleaned up automatically when the lab session ends — there is nothing for you to remove.